How to optimise your Deriv Partner Area performance
Learn how to use Deriv Partner Area analytics to track commissions, conversion rates, and client growth in 2026.
The Deriv Partner Area is a dropdown menu section within your Deriv Dashboard that serves as the headquarters for monitoring earnings, tracking client performance, and optimising your affiliate marketing campaigns. It acts as a business intelligence hub, offering six distinct modules—including Commission Plans and Reports—to help partners track real-time conversion rates and optimise their marketing ROI through data-driven insights.
While the main dashboard provides quick performance snapshots, the Partner Area offers deeper analytical insights that help you better understand how your promotional efforts translate into commission earnings. This comprehensive guide walks you through each section, showing you how you can interpret your data and make strategic decisions that can potentially help boost your earnings.
Key Takeaways
- Master the core Partner Area sections: Navigate Commission Plans, Marketing Materials, Client databases, Partner networks, Activity tracking, and Reports to maximise your affiliate potential
- Analyse high-value data: Read conversion rates, track signup trends, and compare Revenue Share vs. Turnover vs. Master Partner programme effectiveness
- Identify peak trends: Use Campaign Overview charts to correlate your content schedule with client activity spikes.
- Establish a routine: Follow a systematic 4-week review process to continuously improve your strategic planning.
What Is the Deriv Partner Area?
The Partner Area functions as your business intelligence centre, containing six powerful sections that each serve a specific analytical purpose in managing your partnership growth.
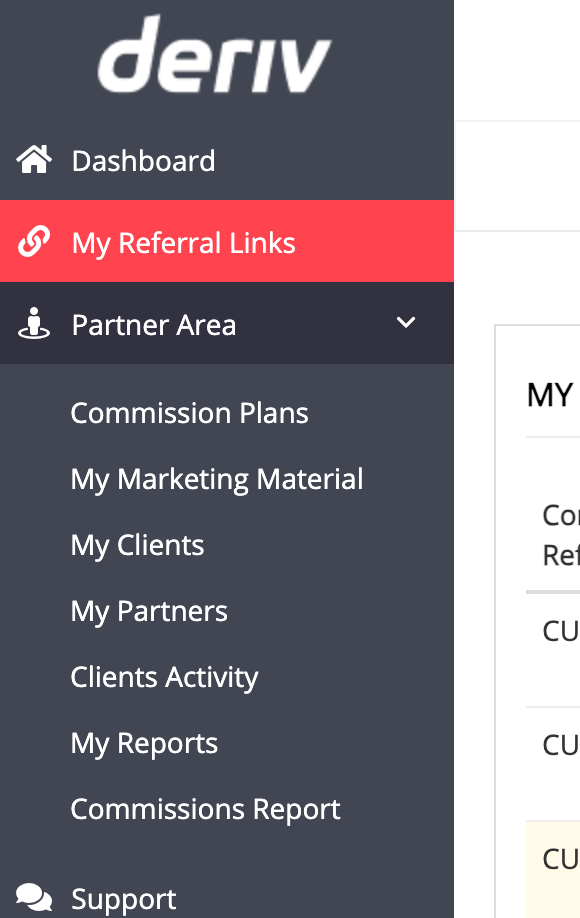
Core Partner Area sections explained
- Commission Plans: View performance snapshots for each structure you are promoting, including conversion rates and acquisition trends. Compare performance across Revenue Share, Turnover, and Master Partner programmes.
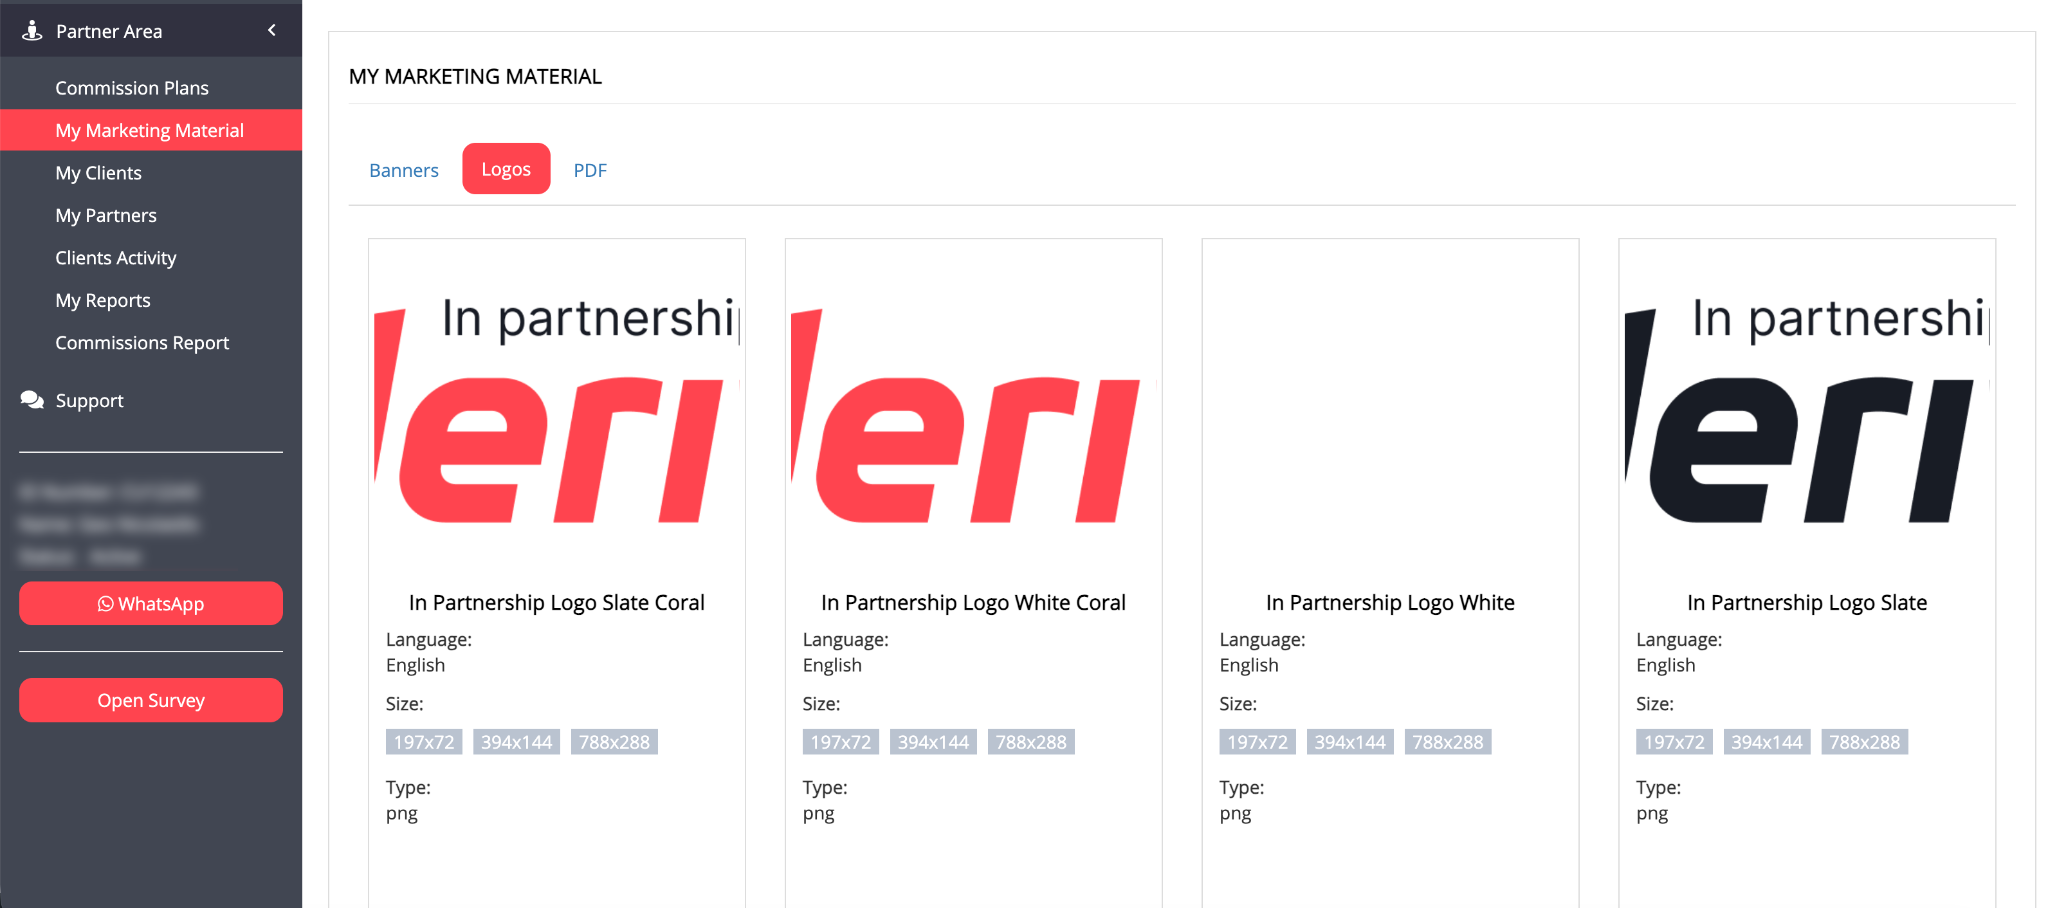
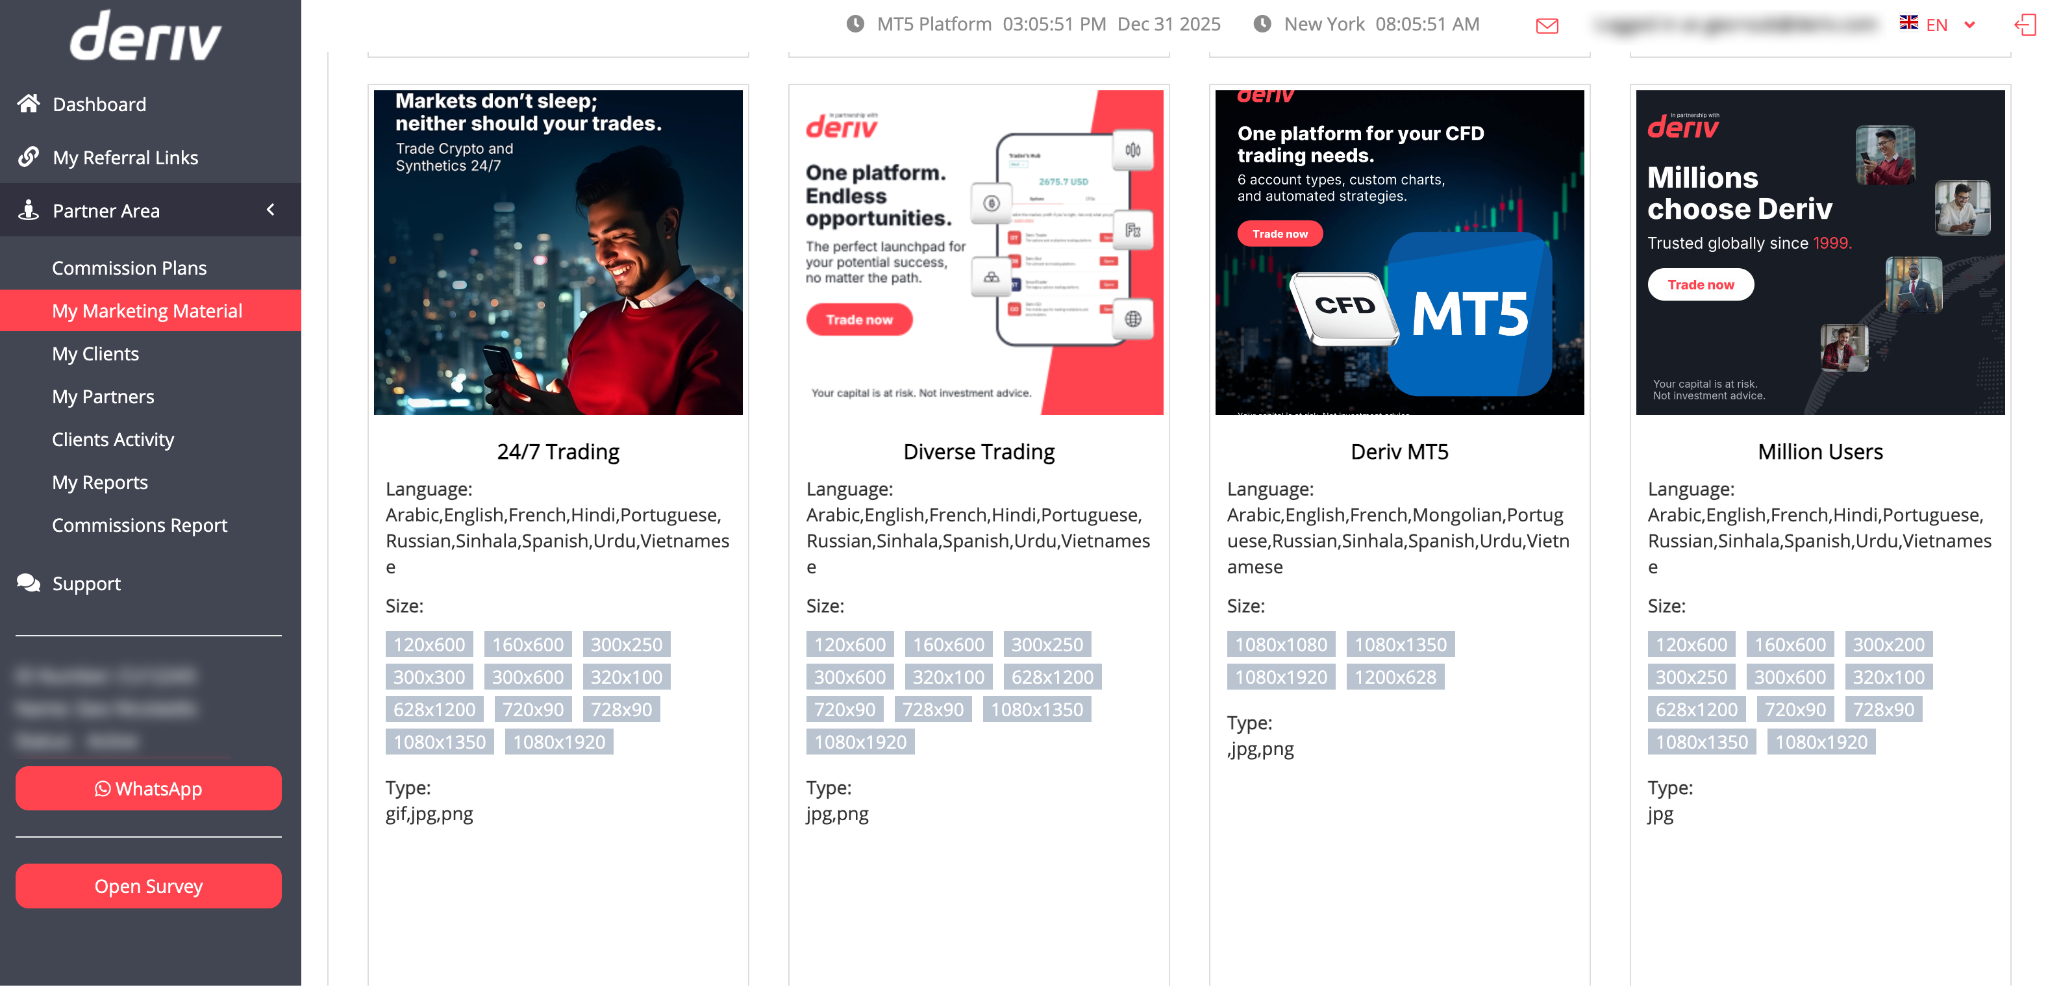
- My Marketing Material: Access ready-made promotional creatives and pre-tagged referral links designed for immediate deployment. For detailed guidance on implementing these links effectively, see our comprehensive referral link usage guide.
- My Clients: A comprehensive database of your referred users, including registration dates and campaign sources.
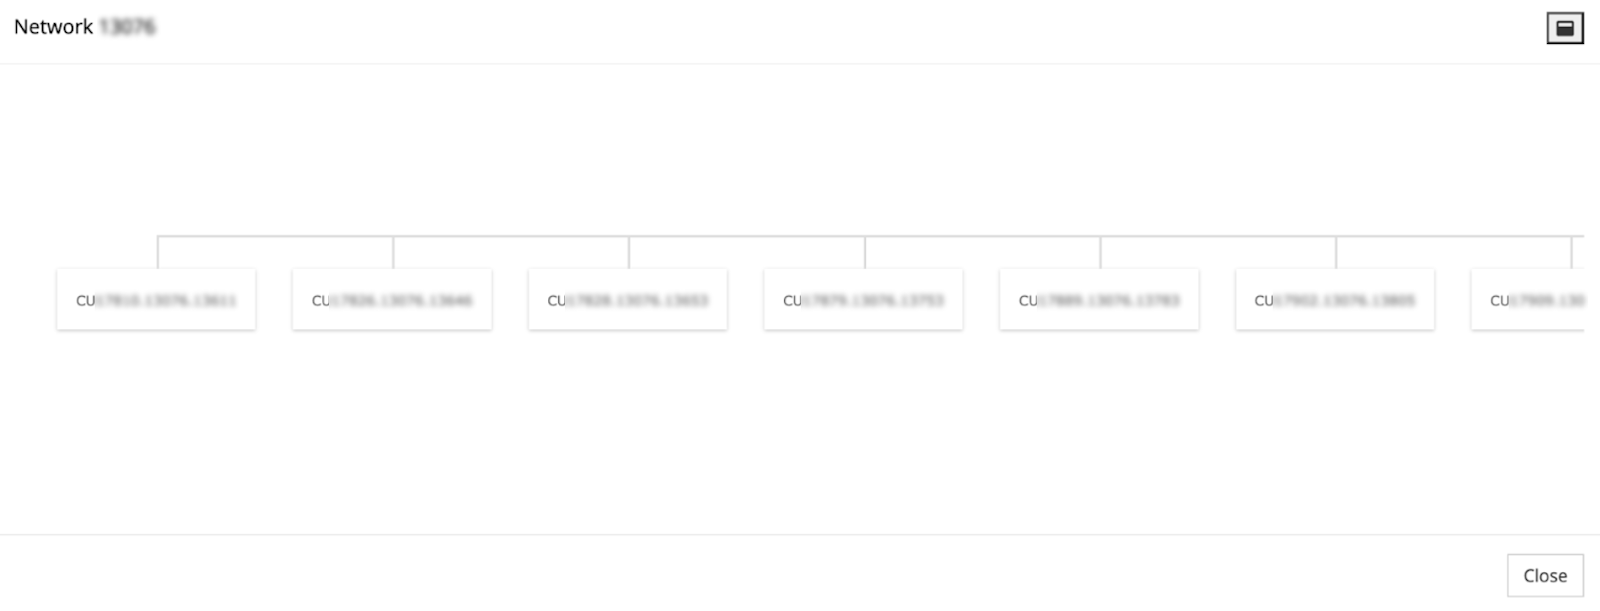
- My Partners: The management interface for your sub-partner network under the Master Partner programme.
- Clients Activity: A breakdown of earned commissions, identifying which referrals generate your highest returns.
Deriv’s commission plans
- Revenue Share: Earn up to 45% of your referred clients' net trading revenue. This model rewards quality referrals with ongoing commissions as long as clients remain active, making it ideal for partners focused on long-term client relationships.
- Turnover: Earn commissions based on your clients' total trading volume regardless of their profit/loss outcomes. Offers daily payouts for products like CFDs and provides more immediate income feedback from active traders.
- Master Partner: Recruit and manage your own network of sub-partners while earning multi-level commissions from both your direct referrals and your sub-partners' performance. This programme allows you to build a team-based affiliate business.
How do I analyse my commission plan performance?
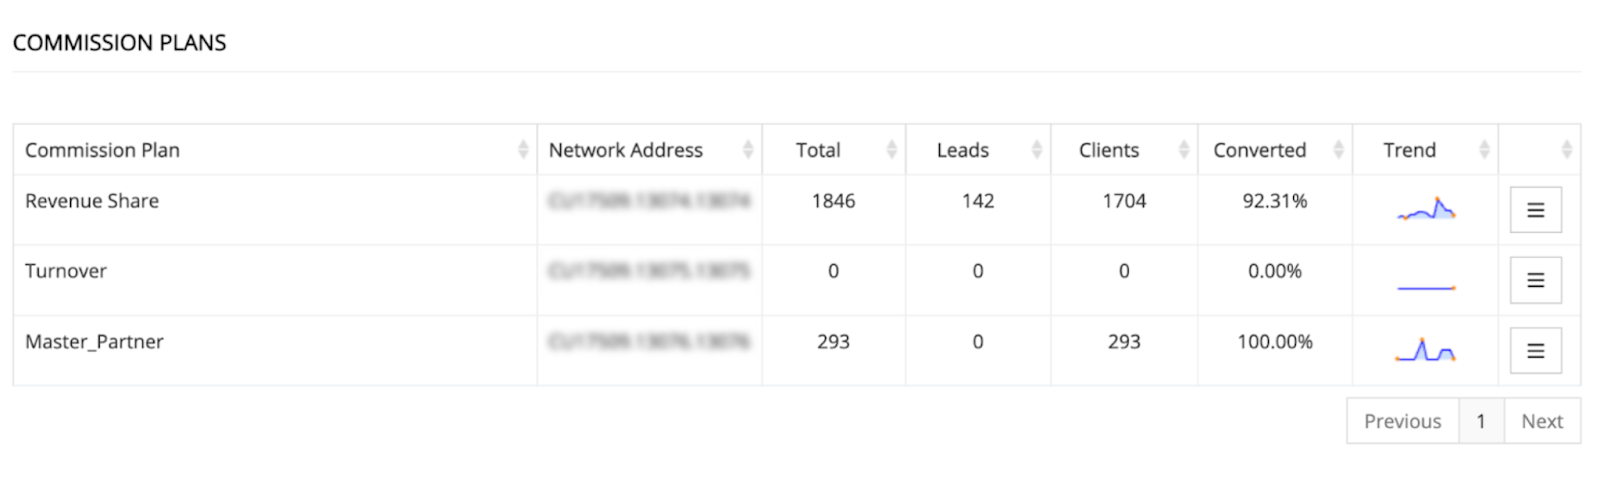
Navigate to the Commission Plans section to access your performance control centre. This page transforms complex affiliate data into actionable insights about your promotional effectiveness across different commission structures.
Reading your dashboard metrics
Each commission plan displays as a separate row with key performance indicators:
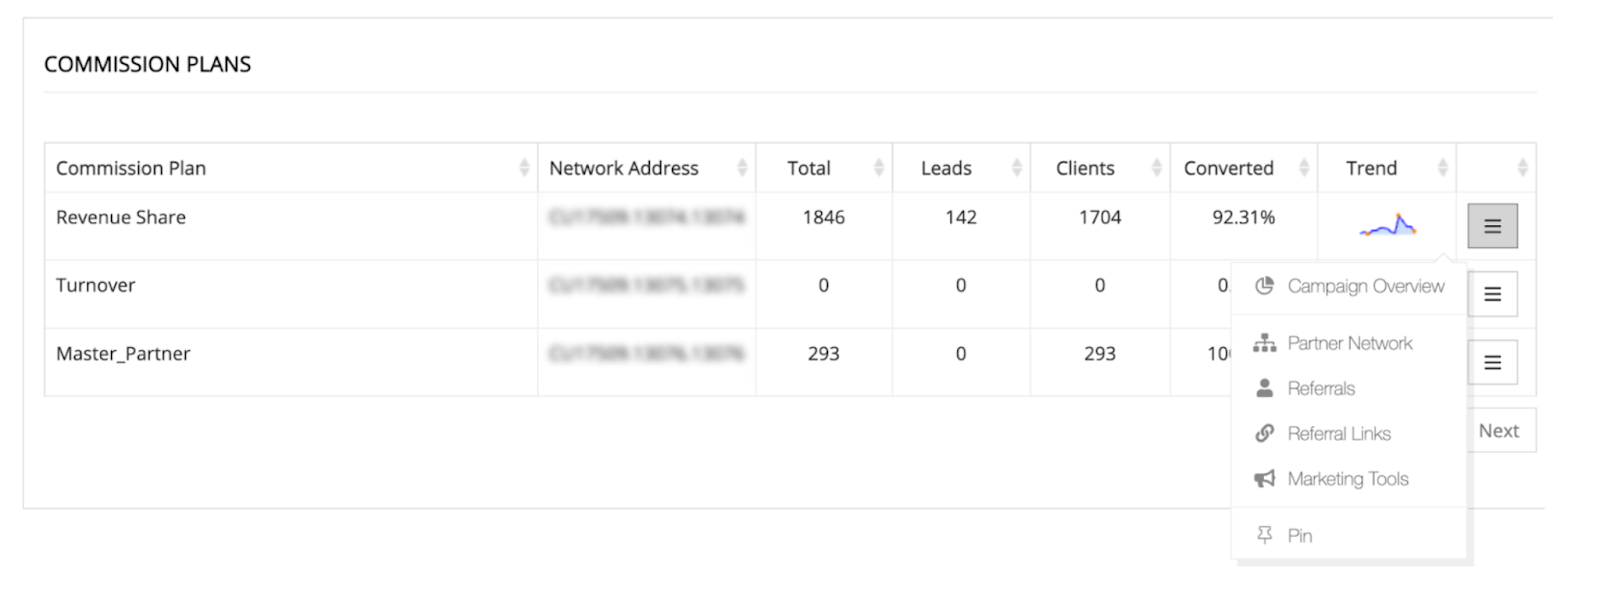
- Plan Name: Identifies which commission structure the data represents (Revenue Share, Turnover, or Master Partner).
- Network Address: Your unique tracking identifier embedded in all referral links for proper attribution.
- Total Signups: Complete count of registrations generated through your promotional efforts for this specific plan.
- Leads vs Clients breakdown: Shows how many signups remain as prospects versus those who've become active trading clients.
- Conversion Rate: Percentage of signups who complete the transition from initial registration to active client status.
- Trend Chart: Visual representation of performance patterns over time, helping you identify successful periods and seasonal variations.
Real performance examples from Commission Plans
Revenue Share performance: A successful Revenue Share campaign might show 2,051 total signups, 121 current leads, 1,930 active clients, and a 94.10% conversion rate. This indicates highly effective targeting and content that attracts serious traders. For detailed guidance on tracking these conversion rates through your main interface, see our Deriv Partner Dashboard guide.
Master Partner results: A Master Partner programme could display 498 total sub-partners with a 100% conversion rate, suggesting successful recruitment strategies focused on committed affiliate marketers.
Turnover plan analysis: While not every partner uses every commission structure, Turnover plans typically show different conversion patterns based on the active trading requirements for commission generation.
How to use Campaign Overview insights
Click the three-line menu next to any Commission Plan row and select "Campaign Overview" to access your comprehensive performance scoreboard.
General Details section breakdown
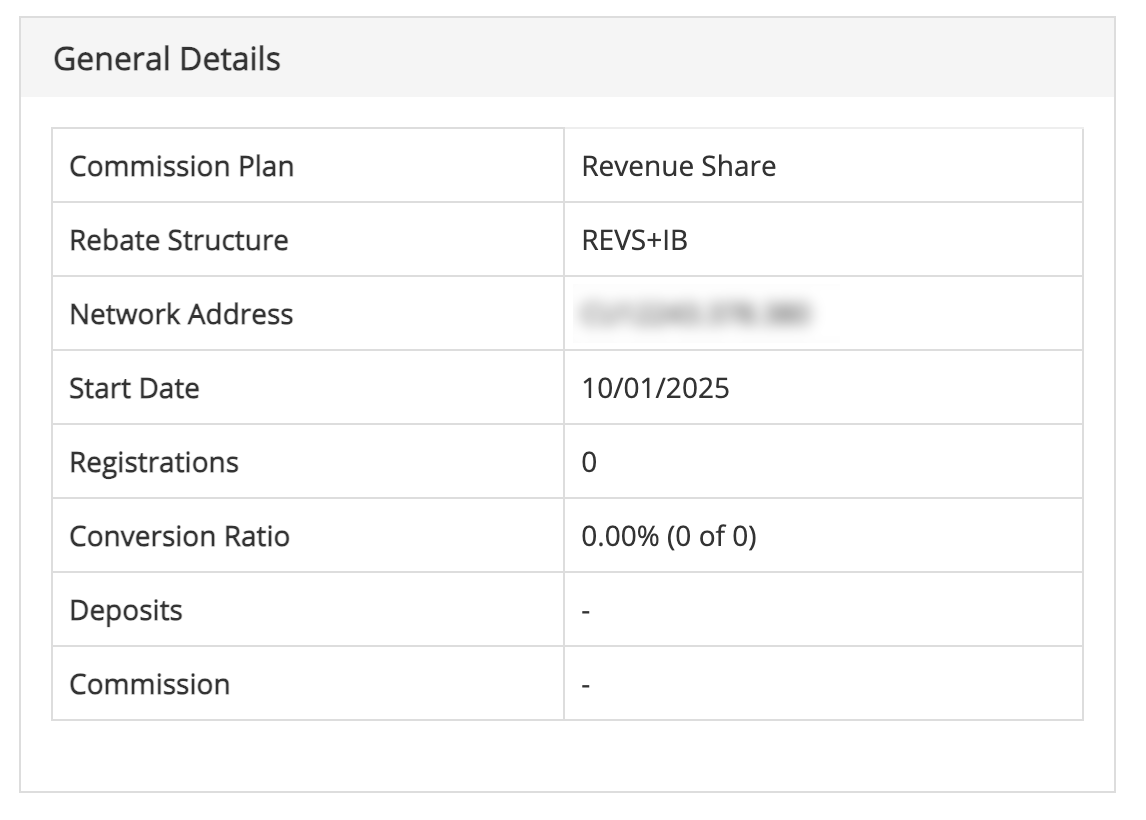
- Commission Plan identification: Confirms which commission structure you're analysing and its specific terms.
- Rebate Structure: Detailed payout rules and commission calculation methods. While you don't need to memorise every detail, understanding these rules helps optimise your promotional strategies.
- Network Address: Your unique tracking ID that ensures proper credit attribution across all promotional channels.
- Start Date: When this commission plan began tracking your performance, useful for calculating ROI and measuring growth over specific periods.
- Total Registrations: Complete audience size you've built through this specific commission plan.
- Conversion Ratio: Critical metric showing what percentage of your signups become profitable clients rather than remaining inactive leads.
- Total Deposits: Aggregate amount your referred clients have deposited, indicating both audience quality and engagement levels.
- Commission Earnings: Your actual earnings from this commission plan, the ultimate measure of campaign success.
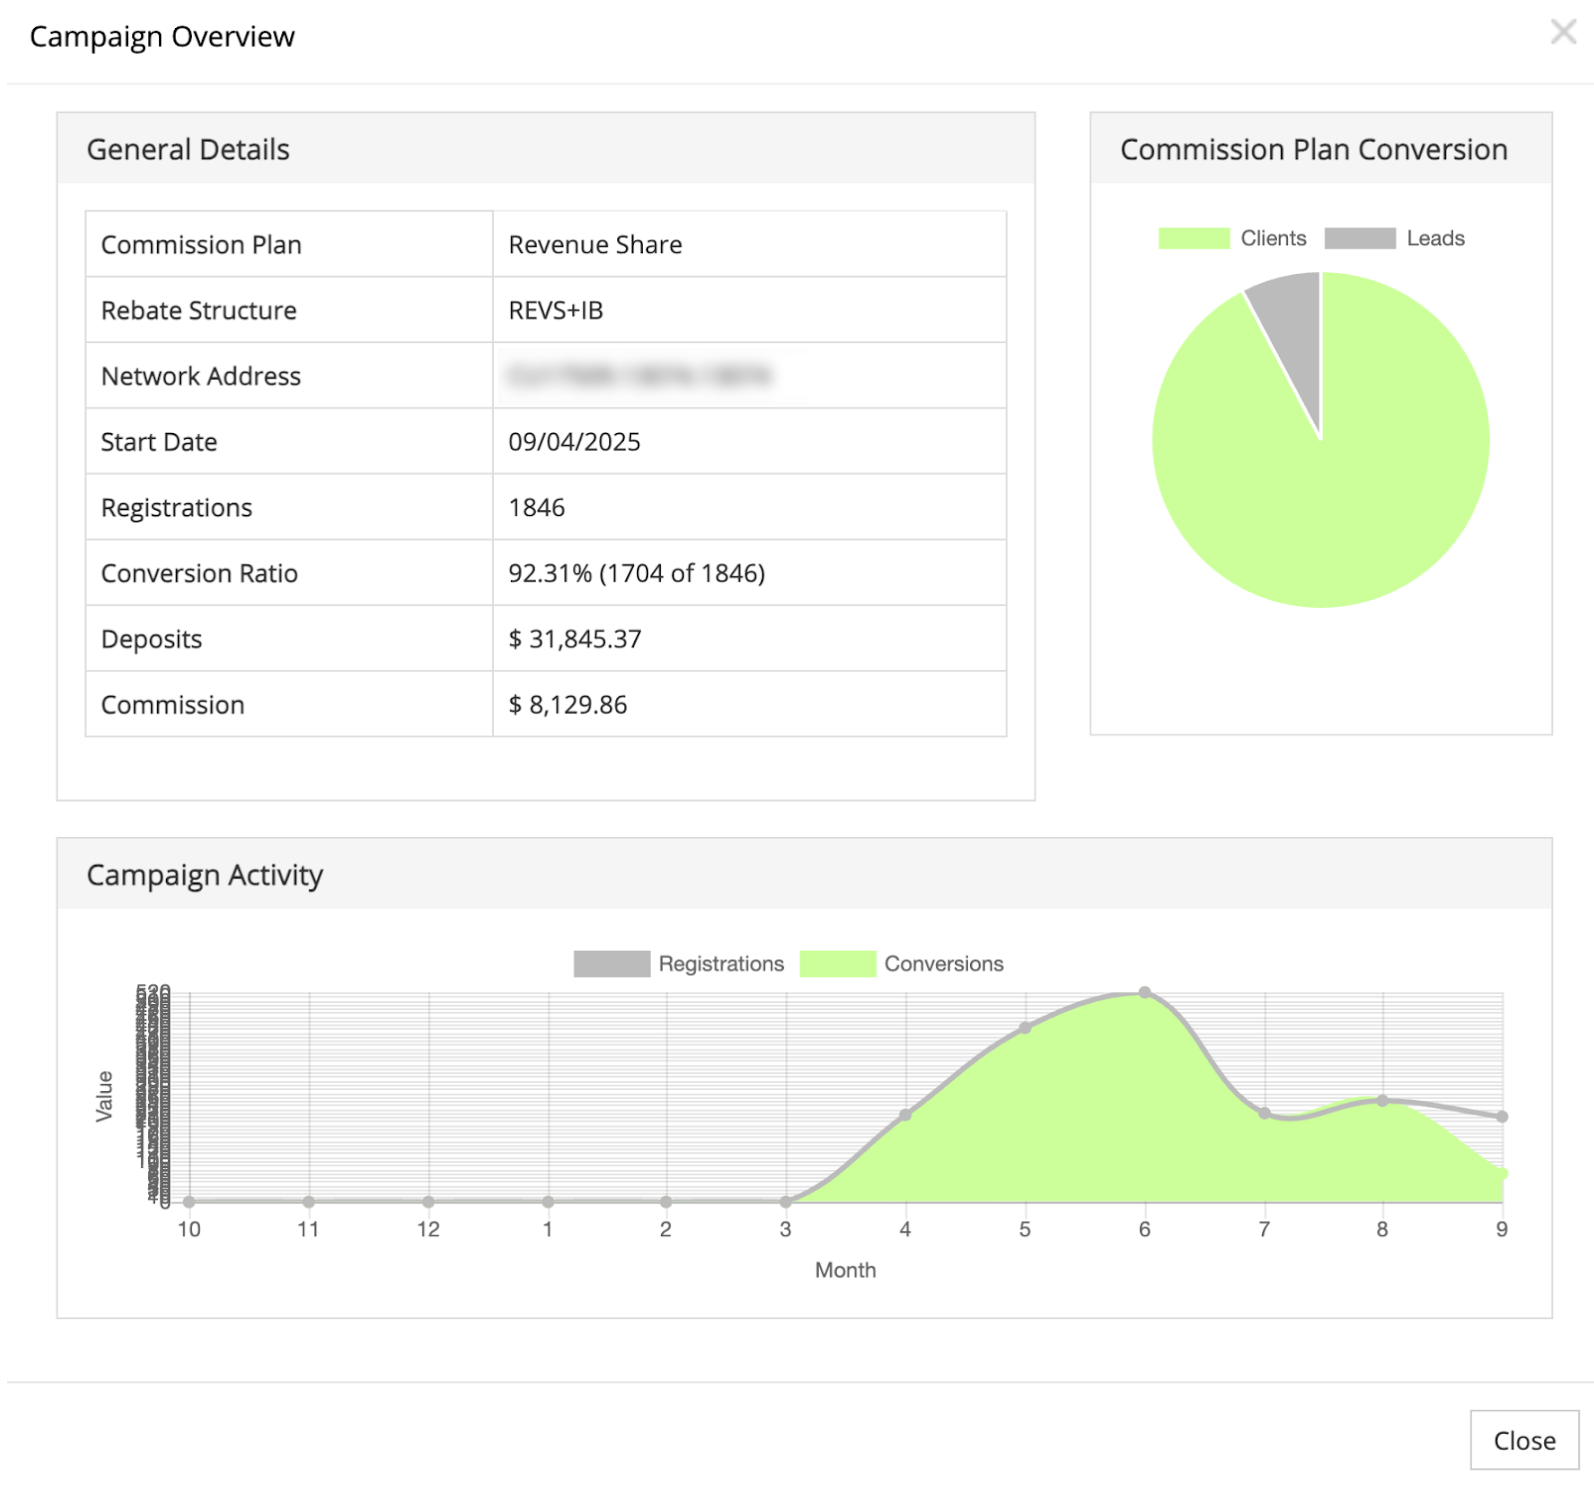
Interpreting your Commission Plan Conversion chart
The pie chart on the right side of your Campaign Overview provides instant visual feedback on your audience quality.
- Green Section (Clients): These are active traders generating commissions. A large green section indicates high-quality targeting.
- Gray Section (Leads): These are prospects who haven't traded yet. Use this data to trigger follow-up educational content.
Understanding campaign activity patterns
According to Claudia Casco, Education Specialist at Deriv, "Partners who regularly analyse these patterns and correlate them with their content calendar typically see better performance consistency than those who ignore seasonal trends. The key is understanding that every spike tells a story about what resonated with your audience."
The bottom chart displays monthly performance trends, with each spike representing periods of increased client engagement and registration activity.
How to identify peak performance periods
- Analyse spikes: What content did you post during high-activity months?.
- Recognise seasonality: Do your leads increase during market volatility or holidays?.
- Optimise flat periods: Use quiet months to test new promotional channels or refresh old content.
Strategic insights: leveraging the Partner Area data for growth
To transform raw data into potential commission income, partners can implement the following performance optimisation strategies:
Performance optimisation strategies
- Content correlation analysis: Compare your Campaign Activity peaks with your content publishing schedule to identify which topics, formats, or promotional approaches generate the best response. For proven promotional strategies and content ideas, explore our referral link promotion guide.
- Conversion rate improvement: Use the green (Clients) vs. gray (Leads) breakdown in your pie chart to determine if you need better initial targeting or improved follow-up strategies.
- Commission plan comparison: Compare conversion rates across different structures to focus your efforts on the most profitable approaches.
- Compliance and best practices: Ensure all campaigns align with Deriv's partnership standards to maintain a compliant and sustainable business. Review our partnership compliance guidelines to maintain compliant promotional practices while maximising your commission potential.
Monthly analysis routine
Following a systematic review process ensures continuous improvement:
- Week 1: Review Commission Plans overview to spot any significant changes in conversion rates or signup volumes.
- Week 2: Dive into Campaign Overview for your top-performing commission plan to understand what's driving success.
- Week 3: Analyse underperforming plans to identify optimisation opportunities or content gaps.
- Week 4: Use insights to plan next month's promotional calendar, doubling down on proven successful strategies.
Tactical vs. strategic adjustments
Short-term tactical adjustments
- Immediate Optimisation: If conversion rates decline, test different landing pages or refresh your promotional messaging.
- Campaign Refinement: Use Network Address tracking to ensure all channels properly attribute signups to the correct plans.
Long-term strategic planning
- Annual Performance Review: Use the My Reports section to analyse year-over-year growth and set realistic targets.
- Audience Development: Use client activity patterns to understand which content attracts the most valuable, long-term clients.
Your Partner Area transforms raw affiliate data into strategic business intelligence. Regular engagement with these analytics helps you understand not just how many people you're reaching, but which promotional strategies create the most valuable, long-lasting client relationships that can potentially generate sustainable commissions.
FAQs
How often should I check my Commission Plans performance?
Commission Plans are commonly reviewed weekly for trend monitoring and detailed Campaign Overview analysis monthly to identify optimisation opportunities and strategic adjustments.
What's a good conversion rate from leads to clients?
Conversion rates vary significantly by audience and promotional strategy, but rates above 80% typically indicate effective targeting and quality content that attracts serious traders.
Why do some signups remain as leads instead of becoming clients?
Leads may need additional nurturing, clearer onboarding guidance, or different educational content to overcome barriers to active trading. Consider follow-up email campaigns focusing on education or simplified getting-started guides.
How can I use Campaign Activity data to improve my results?
Identify your highest-activity periods and analyse what content, promotional channels, or external factors contributed to those peaks, then systematically recreate those conditions.

Quiz