How to track sub-partners and client activity in your Deriv Partner dashboard
Master your Deriv affiliate tracking with our comprehensive partner dashboard guide. Learn commission tracking, client analytics, and performance optimisation.
The Deriv Partner Dashboard is a management platform designed to help partners track performance, manage referral links, and optimise marketing campaigns for maximum commission growth. Track sub-partners and client activity by navigating to the My Partners section to monitor your 20% commission earnings from sub-partner referrals, and accessing the Clients Activity screen to analyse individual client performance patterns. Use the date range filters to generate reports, review the data tables for key metrics, and export to Excel for detailed analysis of traffic quality and partner performance. By mastering the My Partners and Clients Activity modules, you can transform raw data into a scalable recruitment and retention strategy.
Quick summary
- My Partners: Monitor your 20% commission earnings from sub-partner referrals.
- Clients Activity: Analyse individual client trading patterns to verify traffic quality.
- My Reports: Track monthly trends and visualise commission performance over time.
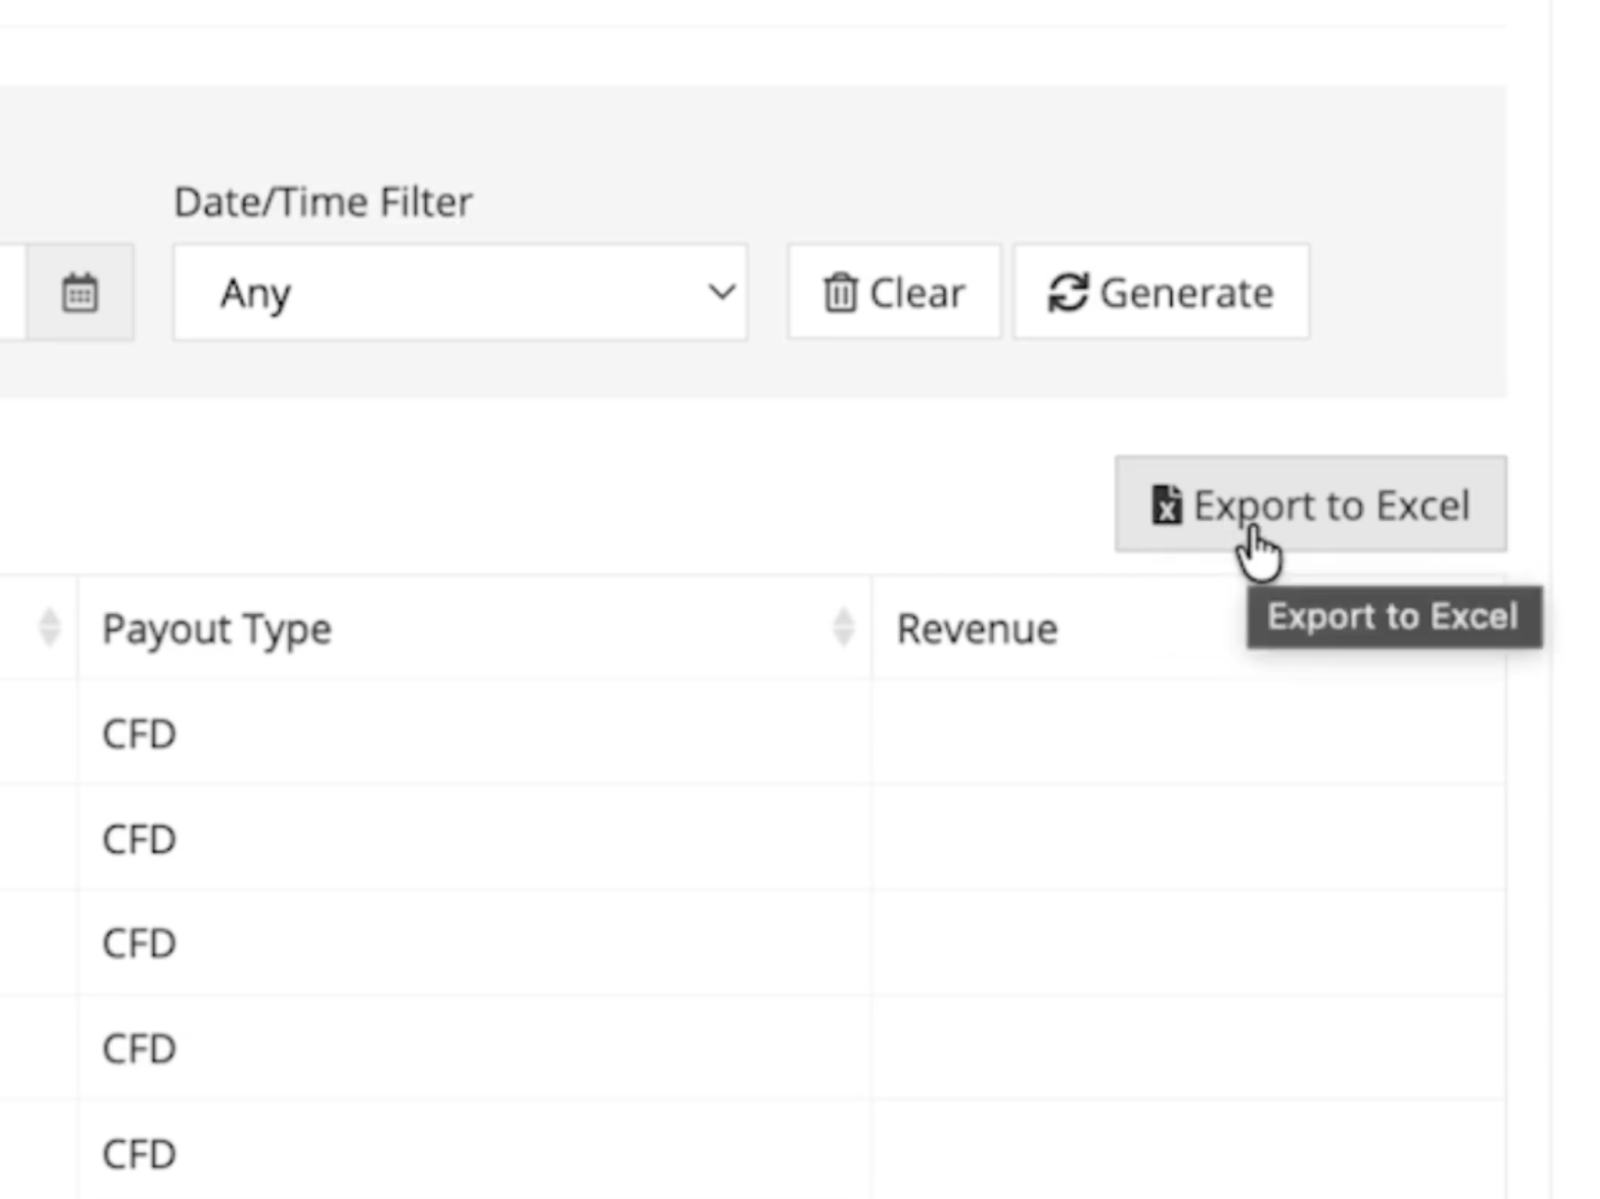
- Data portability: Use date range filters and Excel exports for deep-dive performance analysis.
- Traffic quality: Identify high-value clients vs. low-intent signals to optimise marketing spend.
- Growth strategies: Turn dashboard insights into actionable recruitment and retention tactics.
What data is available in my Deriv Partner dashboard?
Your dashboard provides high-fidelity data across three critical pillars: sub-partner earnings, client activity patterns, and commission performance metrics.
As Claudia Casco, Education Specialist at Deriv, explains, "These reports are your simple scoreboard—they show where your commission comes from, what's working, and what needs attention."
Core analytics components
- My Partners: A sub-partner tracking system showing your 20% commission bonus from their referrals.
- Clients' Activity: A granular log of individual client actions (e.g., trading CFDs on MT5) that generate your primary commission.
- My Reports: A visual performance hub highlighting monthly trends and attribution.
- Data export: Native Excel integration for advanced sorting and campaign optimisation.
Your analytics work together to create a complete performance picture. My Partners shows earnings from your sub-partner network, Clients Activity reveals individual client value, and My Reports combines everything into actionable trends. This interconnected data helps you identify which strategies drive the highest lifetime value.
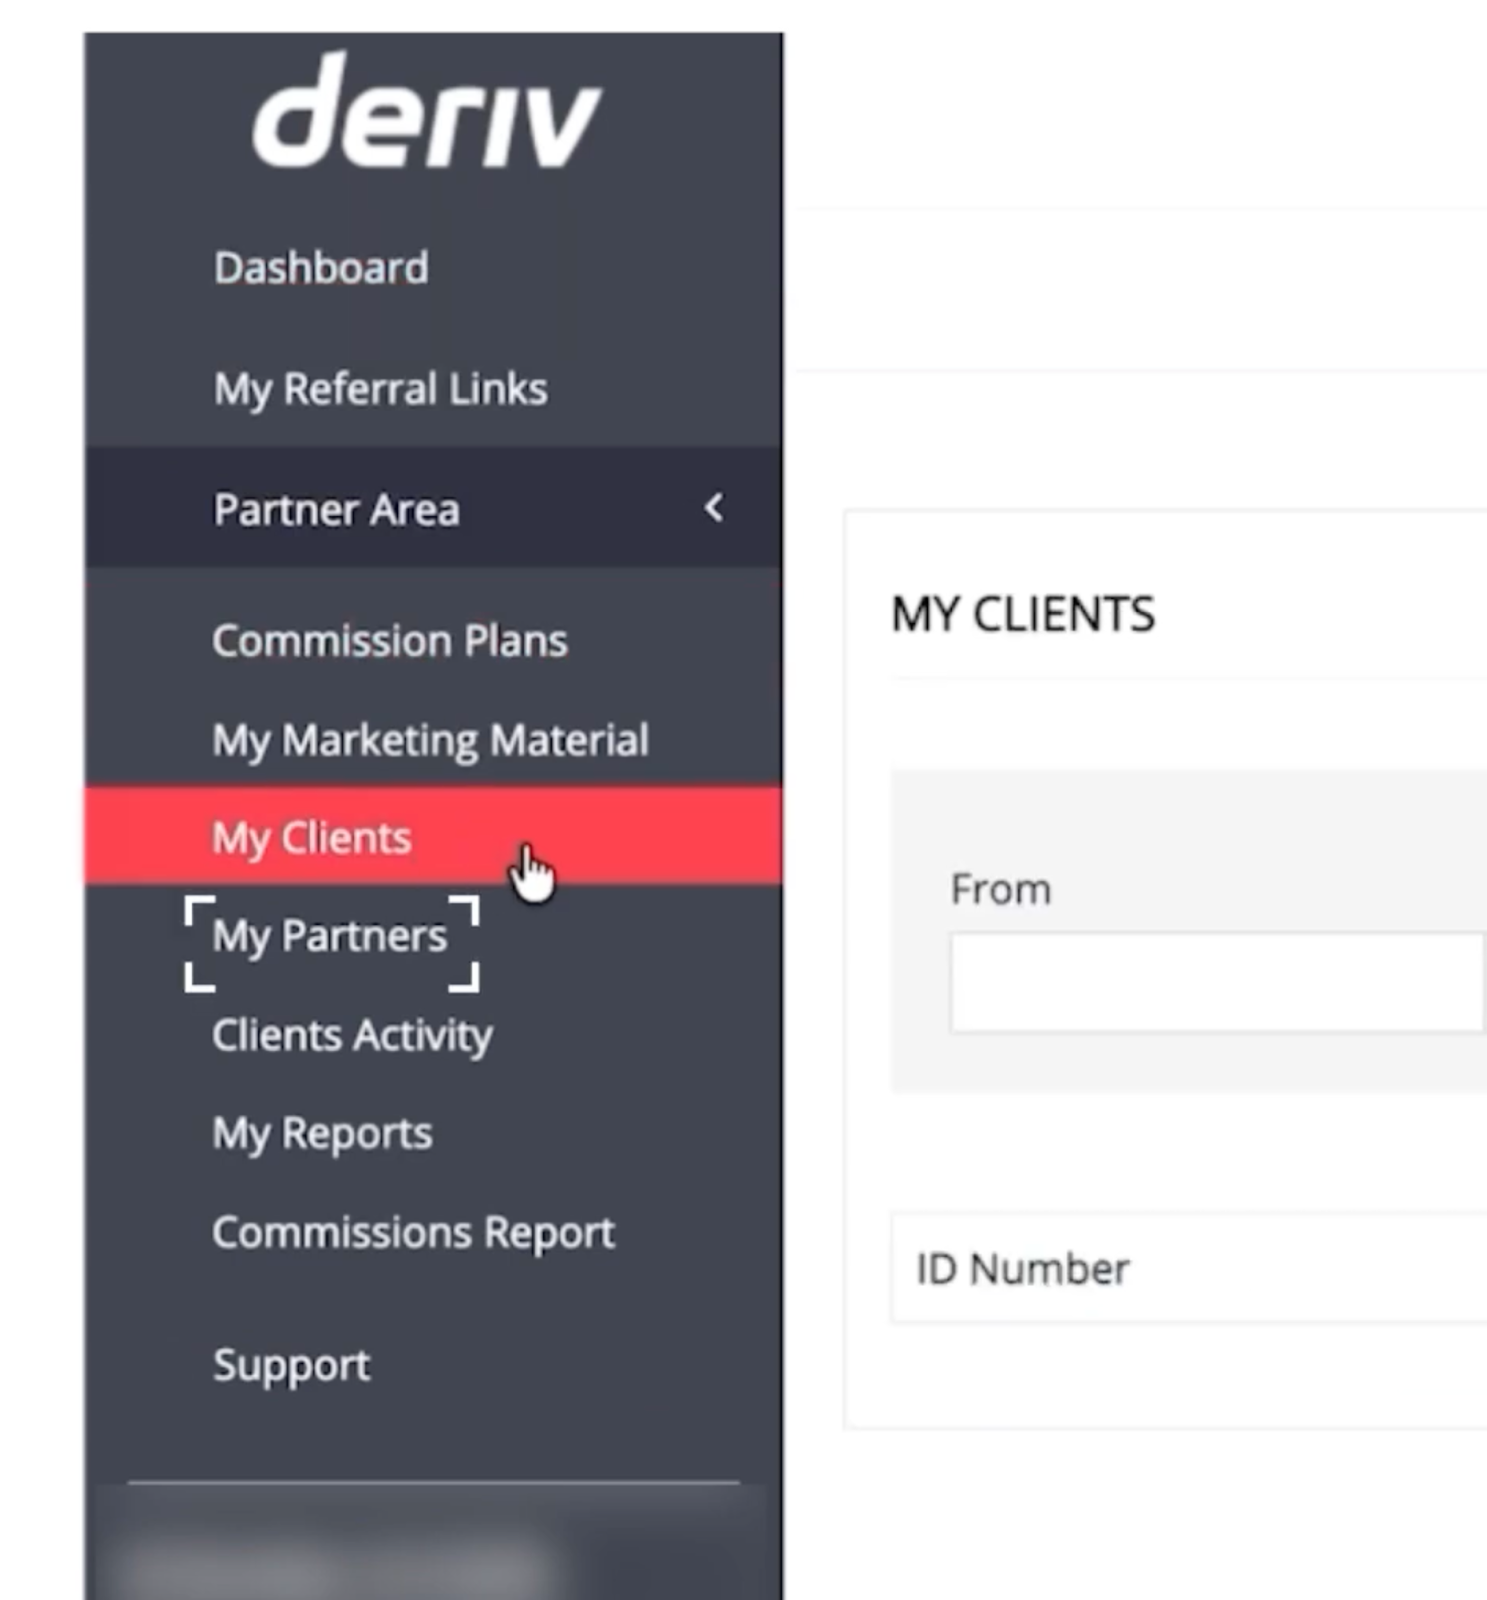
How do I track sub-partner network performance?
The My Partners section reveals earnings from the Master Partner programme. In this structure, you earn a 20% bonus based on the commissions generated by partners you have referred.
Step-by-step tracking
- Set date range: Select your desired window (e.g., August 2025) using the From and To fields.
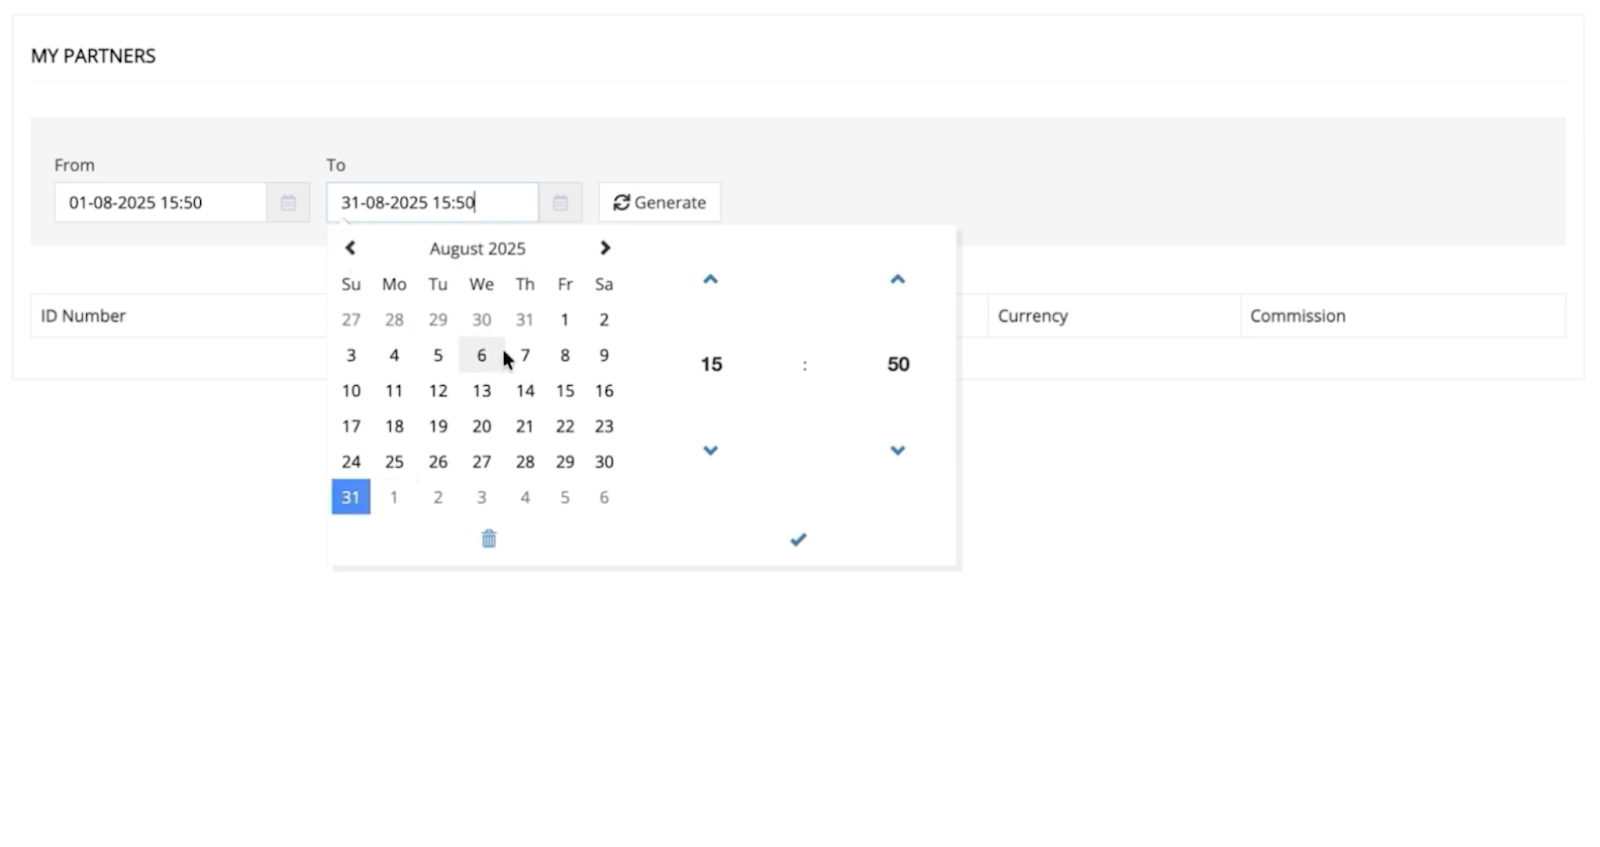
- Click the Generate button to populate the sub-partner data table.
- Audit key metrics:
- ID Number: The unique code for your sub-partner.
- Country/Currency: Geographic and financial origin of your earnings.
- Commission: Your 20% Master Partner bonus for that period.
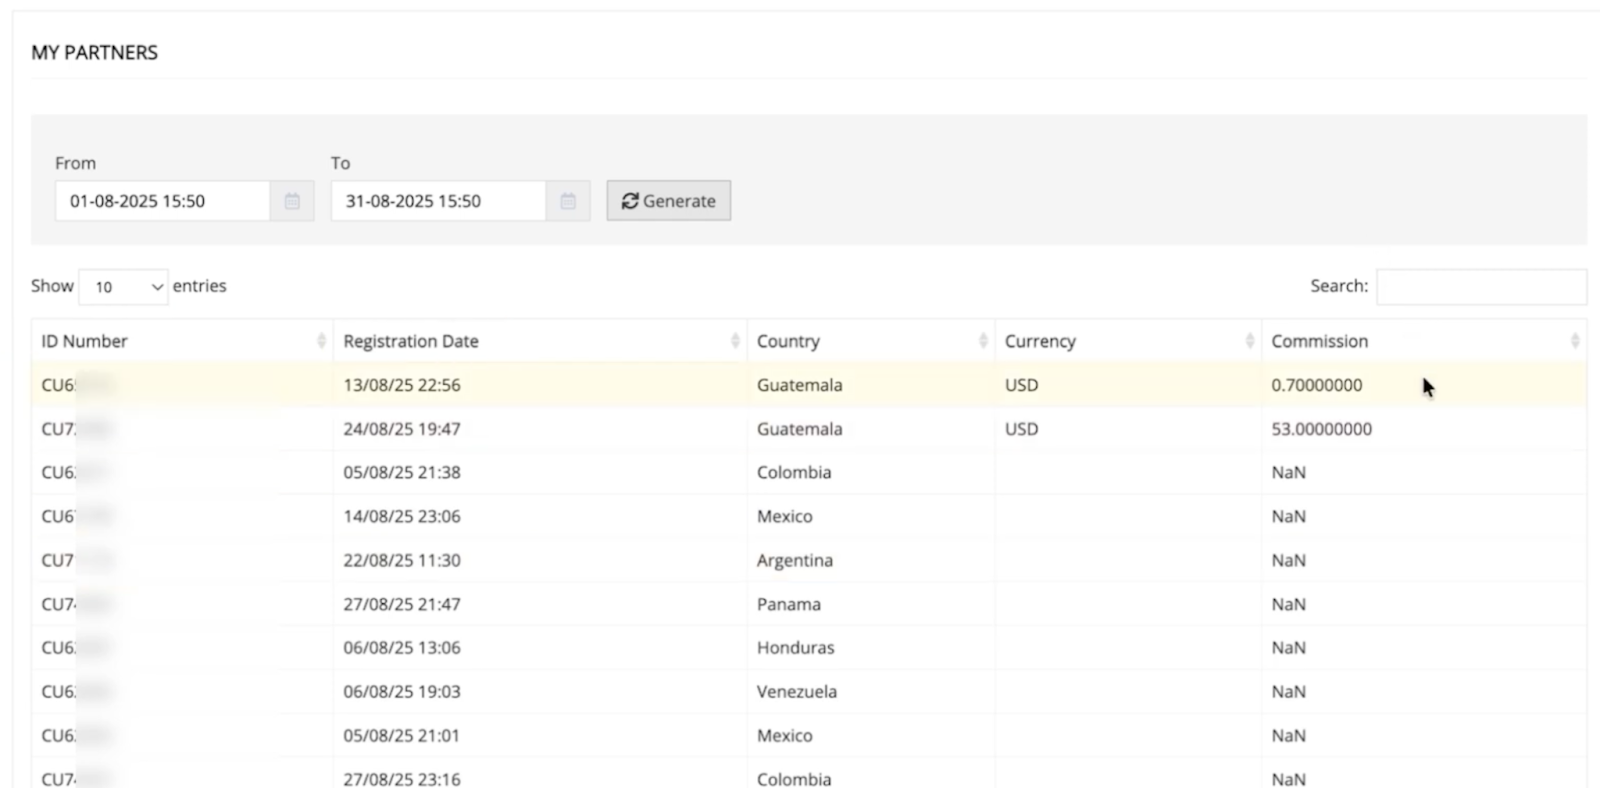
Helpful tip: If you see "NaN" (Not a Number), it indicates the system hasn't recorded activity for that specific window yet. Try expanding your date range to capture historical data.
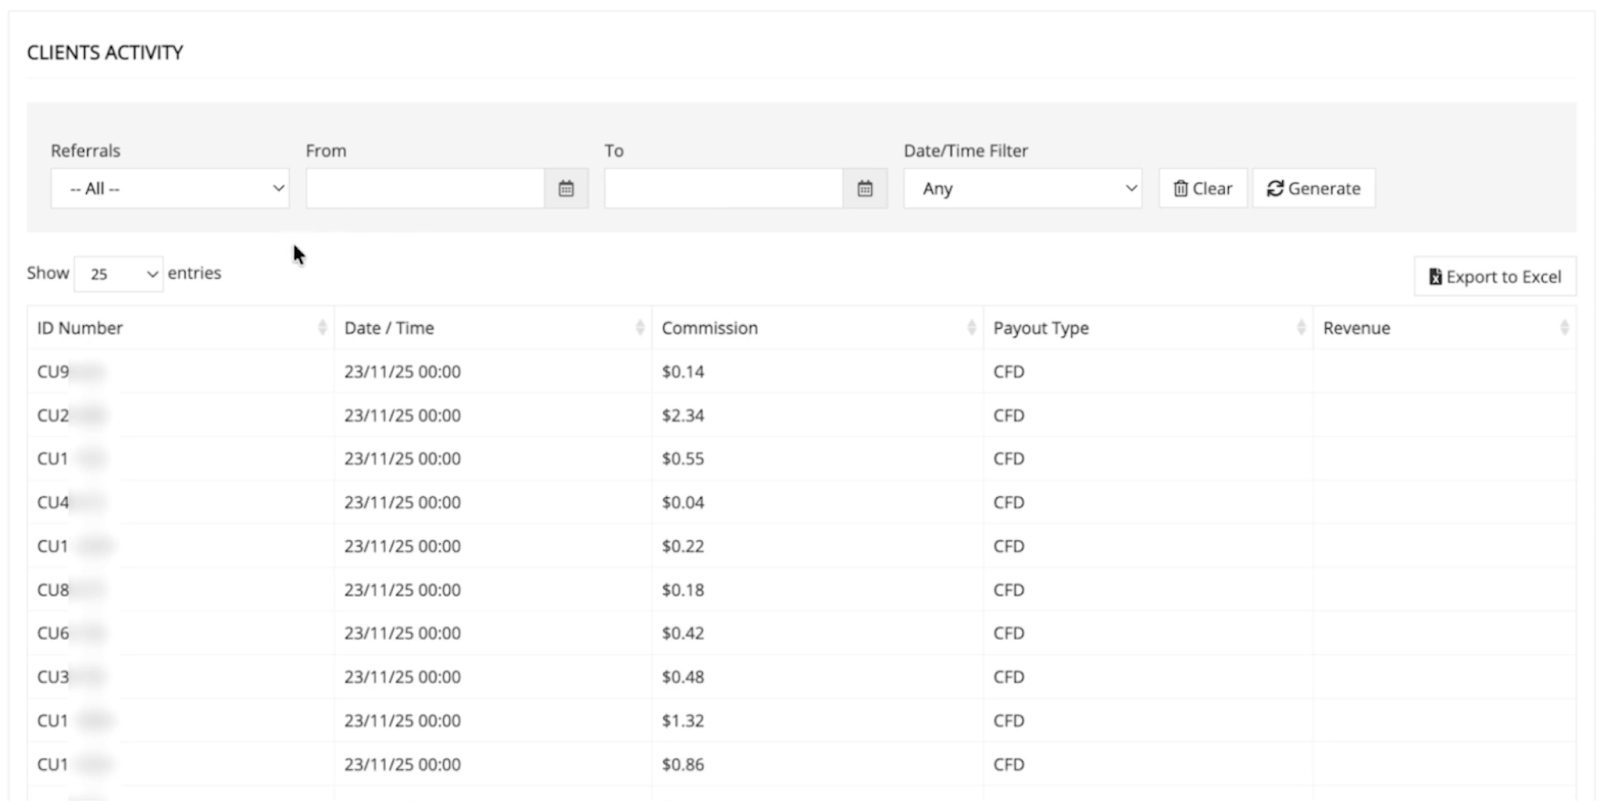
How do I analyse client activity for traffic quality?
The Clients Activity screen is your primary tool for "Traffic Auditing." It helps you distinguish between high-value traders and low-intent clicks.
Each row represents one client action:
- Client ID (example: CU33954) identifies the individual
- Date shows when the trade occurred
- Commission displays your earnings from that specific activity
- Product Type indicates the trading instrument (typically CFD)
High-quality traffic indicators vs. low-intent signals
Master your commission performance dashboard
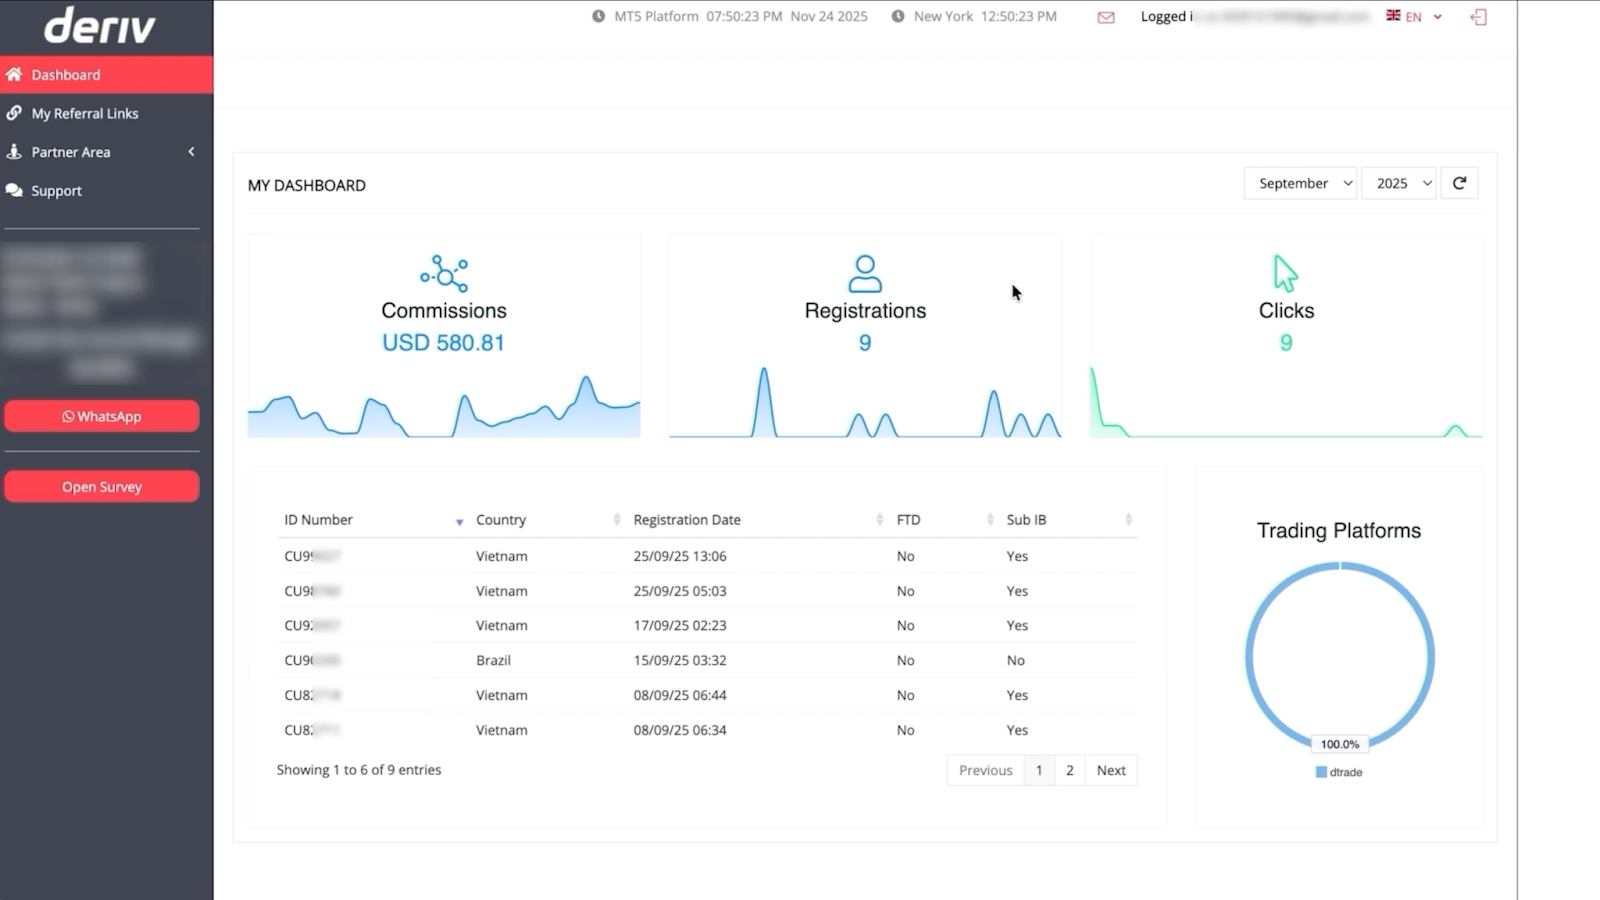
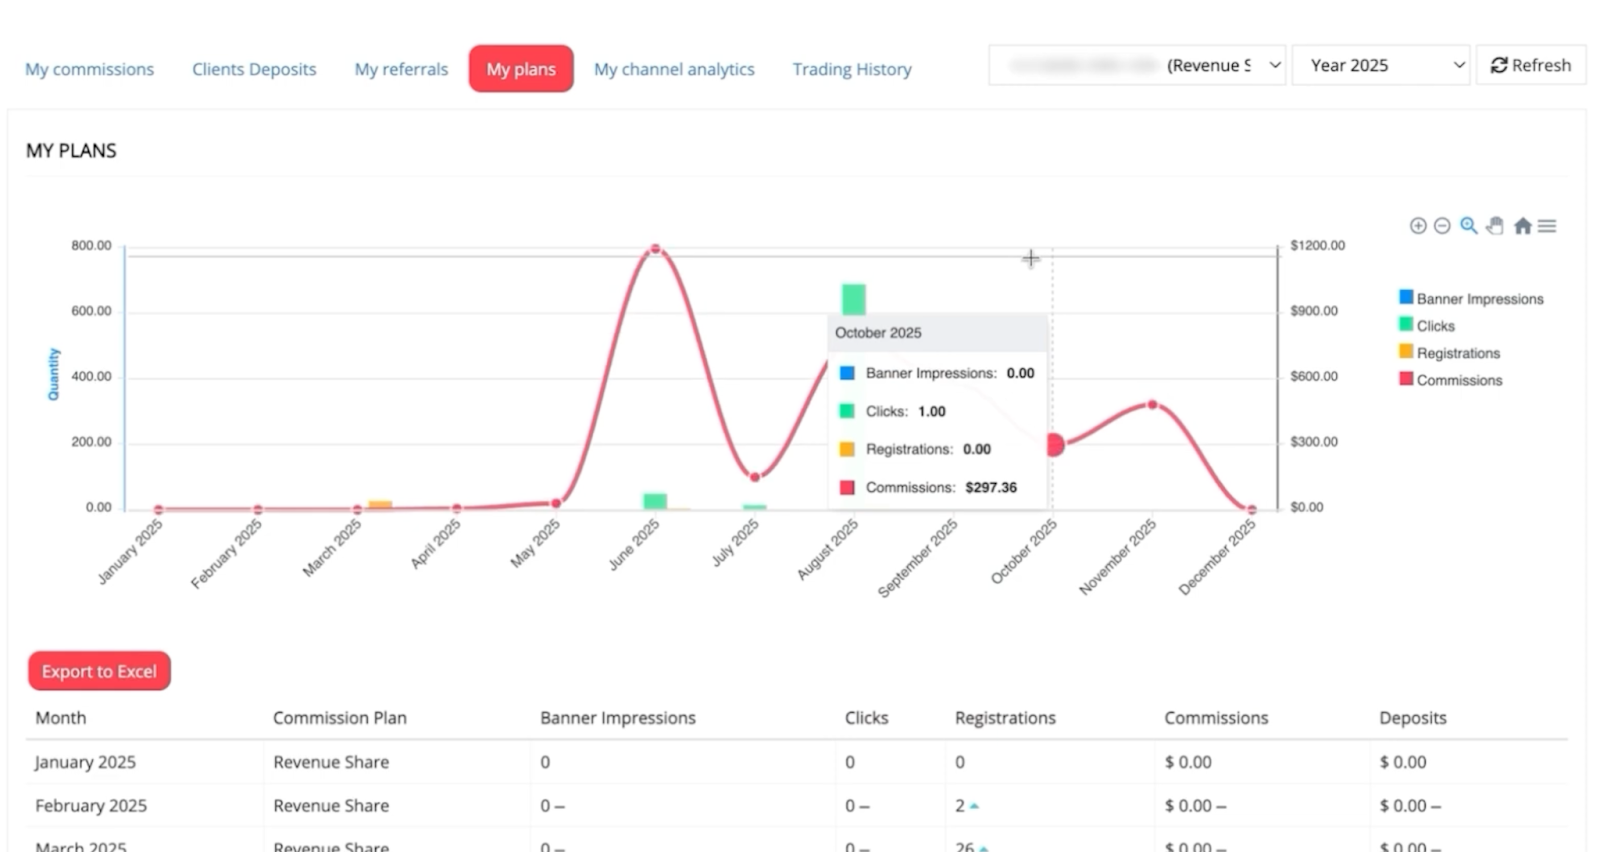
My Reports serves as your comprehensive performance scoreboard, combining automated data into actionable visual insights.
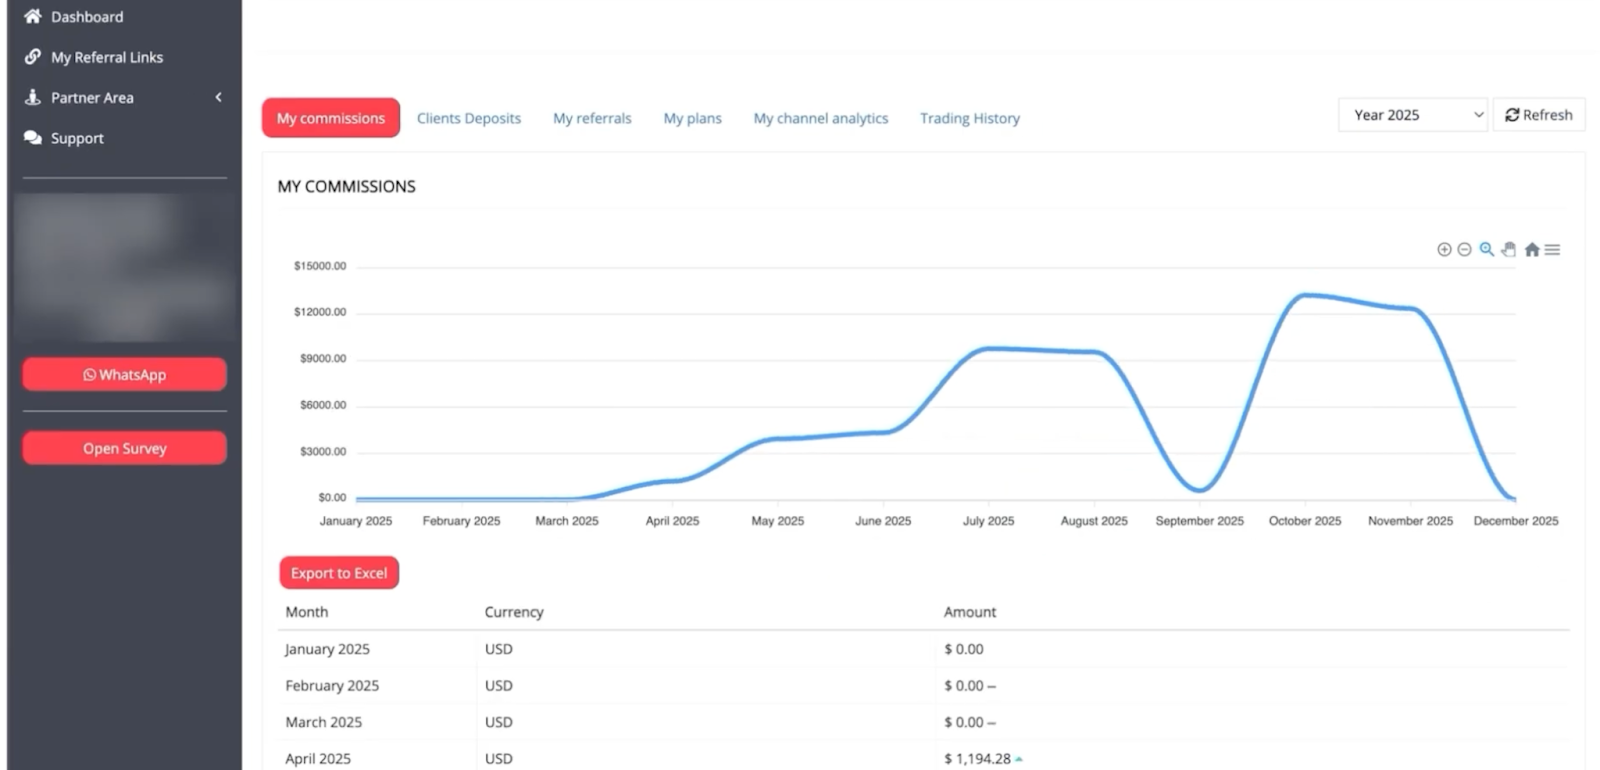
Your main dashboard displays monthly earnings, including both client commissions and sub-partner bonuses. Select your analysis year in the top right and click Refresh to update the visualisation.
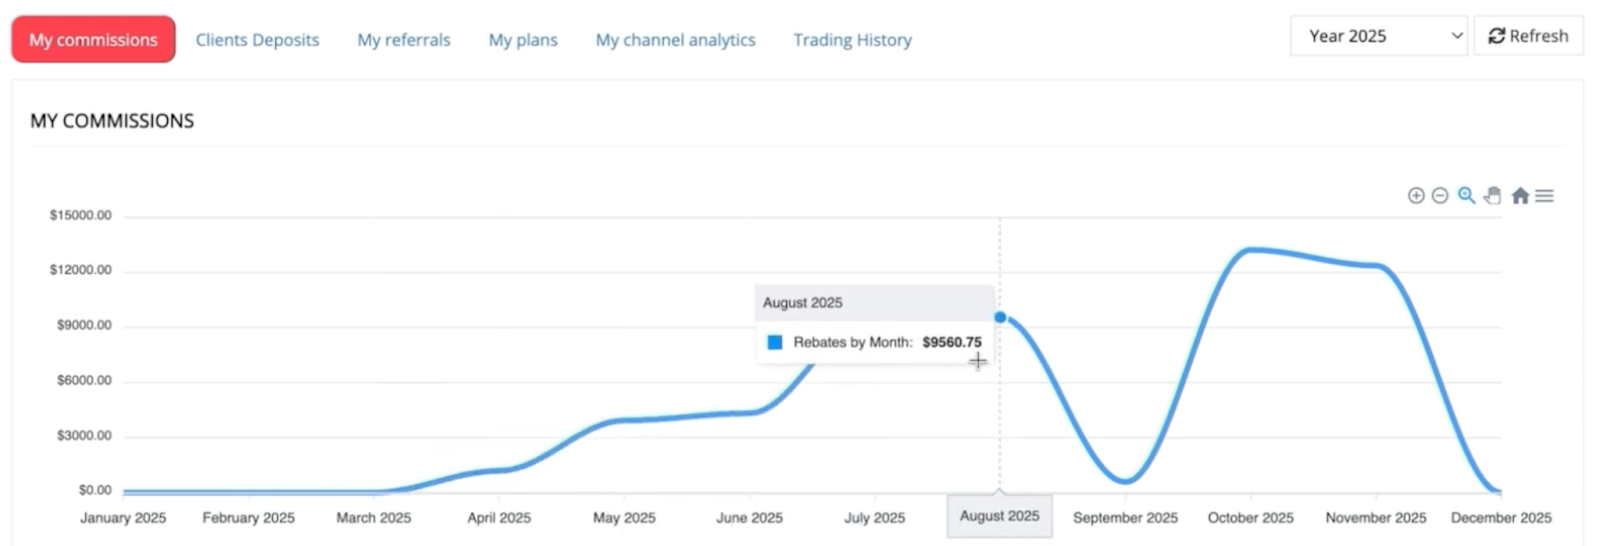
- Interactive trends: Use the blue line graph to spot high-performing months worth replicating.
- MoM comparison: Review month-over-month arrows (up/down indicators) to quickly gauge growth.
- Platform specifics: Filter by product type (e.g., Deriv MT5) to see which trading instruments are driving your revenue.
How to turn analytics into growth strategies
- Weekly data review: Export client activity and sub-partner data to identify top performers and patterns.
- Identify success patterns: Match high-value clients and sub-partners back to specific campaigns or sources.
- Scale what works: Increase budget and effort on proven successful traffic sources and recruitment methods.
- Address weak areas: Fix low-performing campaigns and provide support to underactive sub-partners.
For strategic guidance on choosing the right commission approach, explore our guide on Understanding Deriv's partner commission structure.
Dashboard insights: spot opportunities and take action
FAQs
Why do I see "NaN" in my sub-partner commission data?
This indicates no recorded activity for your selected date range. Try expanding the time period or checking back later, as data processing may be delayed.
What does repeated client IDs in activity reports mean?
Multiple entries for the same client ID show that the person completed several commission-generating actions, indicating high-quality, engaged traffic.
How often should I review my commission analytics?
Weekly reviews help you spot trends early and make timely campaign adjustments. Monthly deep dives with Excel exports provide comprehensive performance analysis.
Can I track which marketing campaigns drive the highest-value clients?
Yes, by exporting client activity data and correlating high-value repeat clients with specific traffic sources, ads, or landing pages.

Quiz