How to track performance across your entire Deriv Partner dashboard
Learn how to track affiliate performance with Deriv partner dashboard analytics. Complete guide to commission tracking tools, referral analytics, and conversion funnel analysis.
The Deriv Partner Dashboard is a comprehensive analytics and management platform that allows partners to track performance, manage referral links, and optimise marketing campaigns to potentially maximise commission earnings. Properly tracking your Deriv Partner Dashboard metrics can potentially increase your commission earnings by identifying optimisation opportunities and preventing revenue leaks.
Track performance across your entire dashboard by systematically reviewing five key sections: monitor client funding patterns in Clients Deposits to predict activity, track monthly acquisition in My Referrals, analyse your complete marketing funnel in My Plans, identify top traffic sources in My Channel Analytics, and review payout history in the Commissions Report.
Quick Summary
- Clients Deposits: Monitor monthly funding patterns as your commission fuel gauge.
- My Referrals: Track client and partner acquisition headcount for growth trends.
- My Plans: Analyse complete funnel from impressions to commissions for optimisation.
- My Channel Analytics: Identify which traffic sources drive the best results.
- Commissions Report: Review payout history and commission breakdowns.
What data is available across your Deriv Partner dashboard?
Your dashboard provides performance data across critical reporting sections that work together to track your complete partner business journey. As Claudia Casco, Education Specialist at Deriv, explains, "Think of these reports as your complete business scorecard—each section shows a different part of your performance story."
Core dashboard sections
- Clients Deposits: Tracks when clients fund their accounts, indicating trading readiness and funding patterns.
- My Referrals: Shows monthly headcount of clients and sub-partners acquired.
- My Plans: Complete marketing funnel analysis from impressions to commissions.
- My Channel Analytics: Traffic source performance and attribution tracking.
- Commissions Report: Payout history and detailed commission breakdowns.
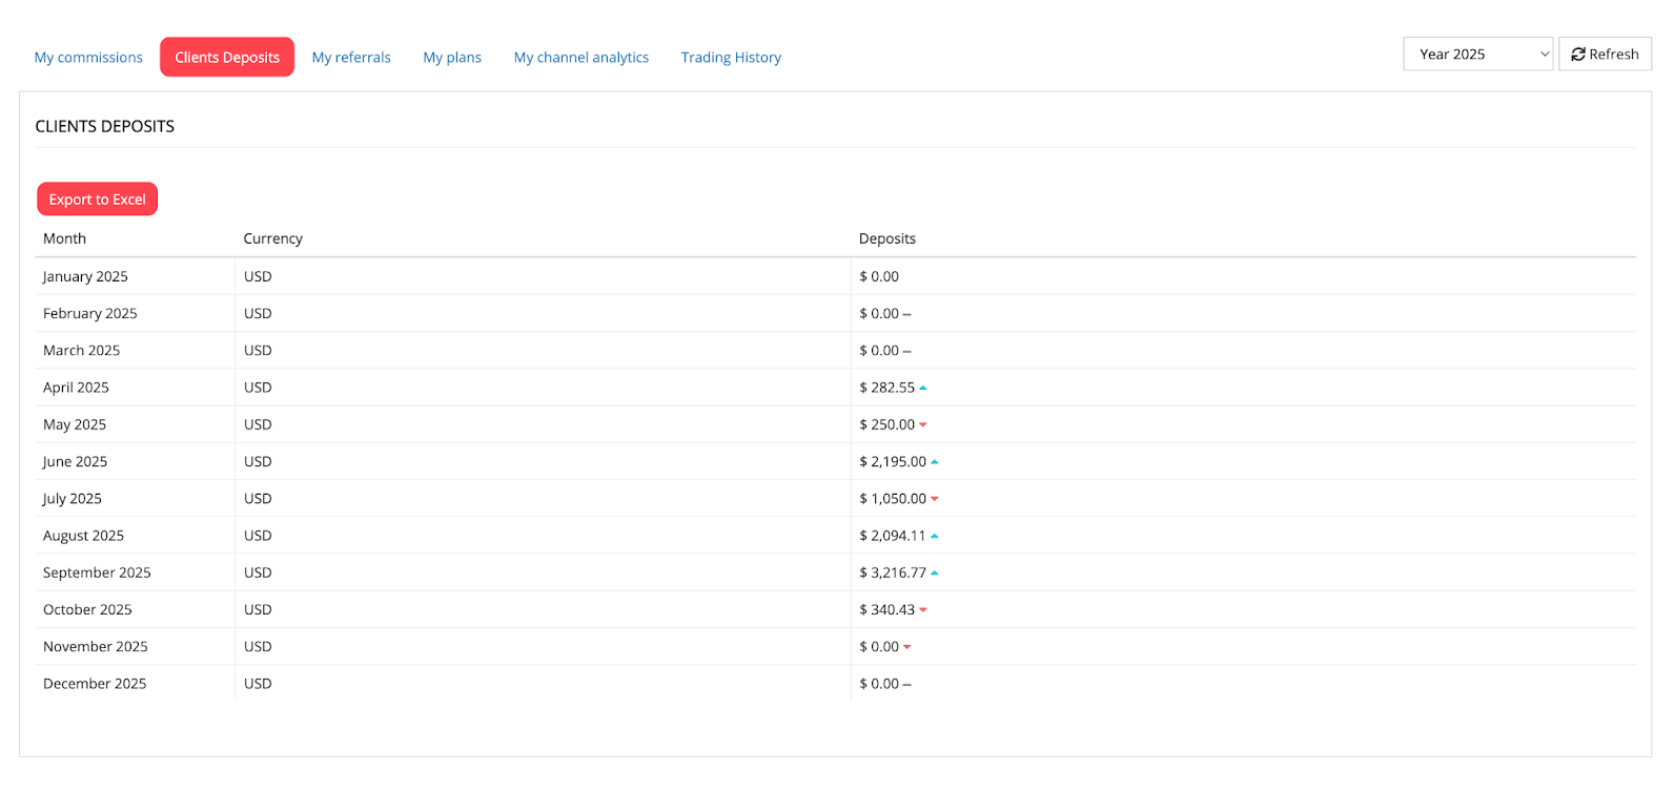
Client deposit tracking: your commission fuel gauge
When clients deposit funds, it suggests they are preparing to trade, providing insight into potential commission generation before payouts appear.
How to track deposit performance
- Select Year: Choose your analysis year in the top right corner.
- Refresh: Click to update the monthly deposit table.
- Review Trends: Check the trend arrows beside numbers to see growth or decline compared to the previous month.
Helpful Insight: If deposits are rising but commissions are flat, clients may need more education on how to start trading.
Understanding partner referral analytics in My Referrals
My Referrals shows your monthly acquisition numbers—the foundation of your commission flow. This section separates clients (traders) from partners (sub-partners) to help you understand different growth streams.
Understanding referral categories
- Clients: Direct traders you referred who generate immediate commissions
- Partners: Sub-partners who can recruit their own networks for long-term growth
- Total: Combined monthly acquisition numbers
How to interpret referral patterns
How to analyse your complete marketing funnel
The My Plans section tracks the journey from initial exposure to actual earnings.
- Impressions: Number of people who saw your promotional content.
- Clicks: Visitors who engaged with your tracking links.
- Registrations: Users who successfully opened a Deriv account.
- Deposits: Clients who funded their accounts to begin trading.
- Commissions: Your actual earnings based on client trading activity
Performance analysis example
Conversion optimisation strategies
- Low click-to-registration rates
- Simplify landing pages and sign-up flow
- Ensure tracking links open correct Deriv registration
- Test stronger benefit messaging above the fold
- Good registrations, weak deposits
- Improve post-registration activation content
- Send KYC guidance and payment method tutorials
- Create first-trade walkthrough materials
- Strong deposits, lagging commissions
- Share platform tutorials and trading strategies
- Provide risk management education
- Send trading confidence-building content
Track traffic source performance
My Channel Analytics shows results by specific traffic channels, but only when using properly tagged channel links. This section is your primary tool for identifying which platforms—like YouTube, Telegram, or a personal blog—deliver your highest-quality leads.
Step-by-step attribution setup
- Create custom channels: Build separate, named channels for each traffic source to isolate your data performance.
- Use tagged tracking links: Always use complete links with tracking parameters to ensure the dashboard assigns the lead to the correct source.
- Maintain link parameters: If using QR codes or link shorteners, verify that the tracking parameters are preserved.
How to read your dashboard performance indicators
Understanding how to interpret your channel indicators helps you troubleshoot tracking issues and refine your marketing strategy.
- Zero banner impressions: This is common and expected if you are driving traffic through direct social media links rather than static website banners.
- System default channel: This indicates that while your links are working, they are untagged; the dashboard knows a lead arrived, but cannot attribute it to a specific campaign.
- Multi-channel comparison: Use these metrics to compare the "Quality of Lead" across different platforms, scaling the sources that show the highest deposit-to-commission conversion.
How to generate and audit your commission reports
The Commissions Report provides your complete payout history and granular financial data. Use this section to verify that your marketing performance is converting into actual profit.
- Set Filters: Leave "Is Paid" on All and keep date fields empty for a full history.
- Execute: Click Generate to view your financial records.
Key data points to monitor
- Payment Reference: Unique ID for tracking payouts.
- Calculation Date: The date when the system finalises your earnings.
- Commission Amount: Earnings broken down by currency.
- Payment Status: Shows if funds are Available or Paid.
Partner Pro-Tip: Click "Trades Analysis" on any line to see the specific trades that generated your earnings, ensuring 100% transparency.
Dashboard insights: spot opportunities and take action
How to turn dashboard data into growth strategies
- Weekly Cross-Section Review: Export data from each section and identify patterns across your complete funnel.
- Identify Performance Drivers: Match high-performing periods in My Plans with specific traffic sources in My Channel Analytics.
- Scale Successful Patterns: Replicate campaigns and channels that show strong conversion rates and commission generation.
- Fix Weak Points: Address low conversion stages using targeted improvements (better onboarding, enhanced education materials).
Next steps: establish your dashboard routine
Set up weekly reviews focusing on recent trends across all sections. Use monthly deep-dives with exported data to identify seasonal patterns and optimise campaign timing.
For strategic guidance on maximising commission structures, explore our guide on Understanding Deriv's partner commission structure.
FAQs
Why do I see zeros in some sections?
Zero values indicate either no activity for that period or that the data is unavailable. Check different date ranges or contact support if the issue persists.
How often should I review all dashboard sections?
Weekly quick reviews help identify immediate trends, while monthly comprehensive analyses using Excel exports provide strategic insights.
What's the difference between My Plans and My Channel Analytics?
My Plans shows your complete marketing funnel performance, while My Channel Analytics specifically tracks results by traffic source channel.
How do I improve low conversion rates between sections?
Focus on the transition points: improving onboarding can boost conversion from registration to deposit, while providing trading education and platform guidance can help increase conversion from deposit to commission.

Quiz