Understanding your performance and commission statements
Learn where to find your trading commissions, partner tier bonuses, and daily account performance data.
Your commission statements are a time-organised record of your earnings and activity as a Deriv partner. While the Activity section of your Home page shows you what's happening right now, Statements lets you look back — by day, by month, or by quarter — to understand how your business has performed over time. Knowing how to read each view, and what each column is tracking, turns Statements into one of your most useful tools for spotting trends and verifying your earnings.
This article explains how to navigate the Statements section, what every column means, and how to use the three views together.
Quick summary
- Access path: You can access Statements from the Reports section on your Home page.
- Three views: There are three views: Daily, Monthly, and Quarterly. Each shows the same core metrics at a different level of detail.
- Tier visibility: Daily, Monthly, and Quarterly all show core performance activity, but tier-related earnings are shown in the Monthly and/or Quarterly views, not the Daily view.
- Quarterly features: The Quarterly view adds a Quarterly bonus column, which appears separately from Tiers.
- Granular lookup: The Daily view has a Details button for each row that opens a breakdown of that day's activity.
- Strategic utility: Use Daily to investigate a specific date. Use Monthly to track trends over time. Use Quarterly for a high-level picture of your growth.
Key terms to know
- Statements: The historical earnings and performance record in your Partners Hub. It organises your data by day, month, and quarter.
- Commissions: Earnings generated by your clients' trading activity. This figure reflects your client's trading activity in the selected period.
- Tiers: Bonus earnings linked to your partner tier level. These are separate from your trading commissions and appear as their own column in the Monthly and Quarterly views.
- Quarterly bonus: An additional earnings category visible in the Quarterly view. It appears as a separate column from Tiers.
- Signups: The number of new client accounts attributed to you in the selected period.
- Deposited: The number of attributed clients who made their first deposit in the selected period.
- Traded: The number of your attributed clients who placed a trade in the selected period.
How do I access my commission statements in the Deriv Partners Hub?
Statements is not a separate navigation item. You reach it from the Reports section on your Home page.
Illustrative figures only — not verified or representative of typical earnings.
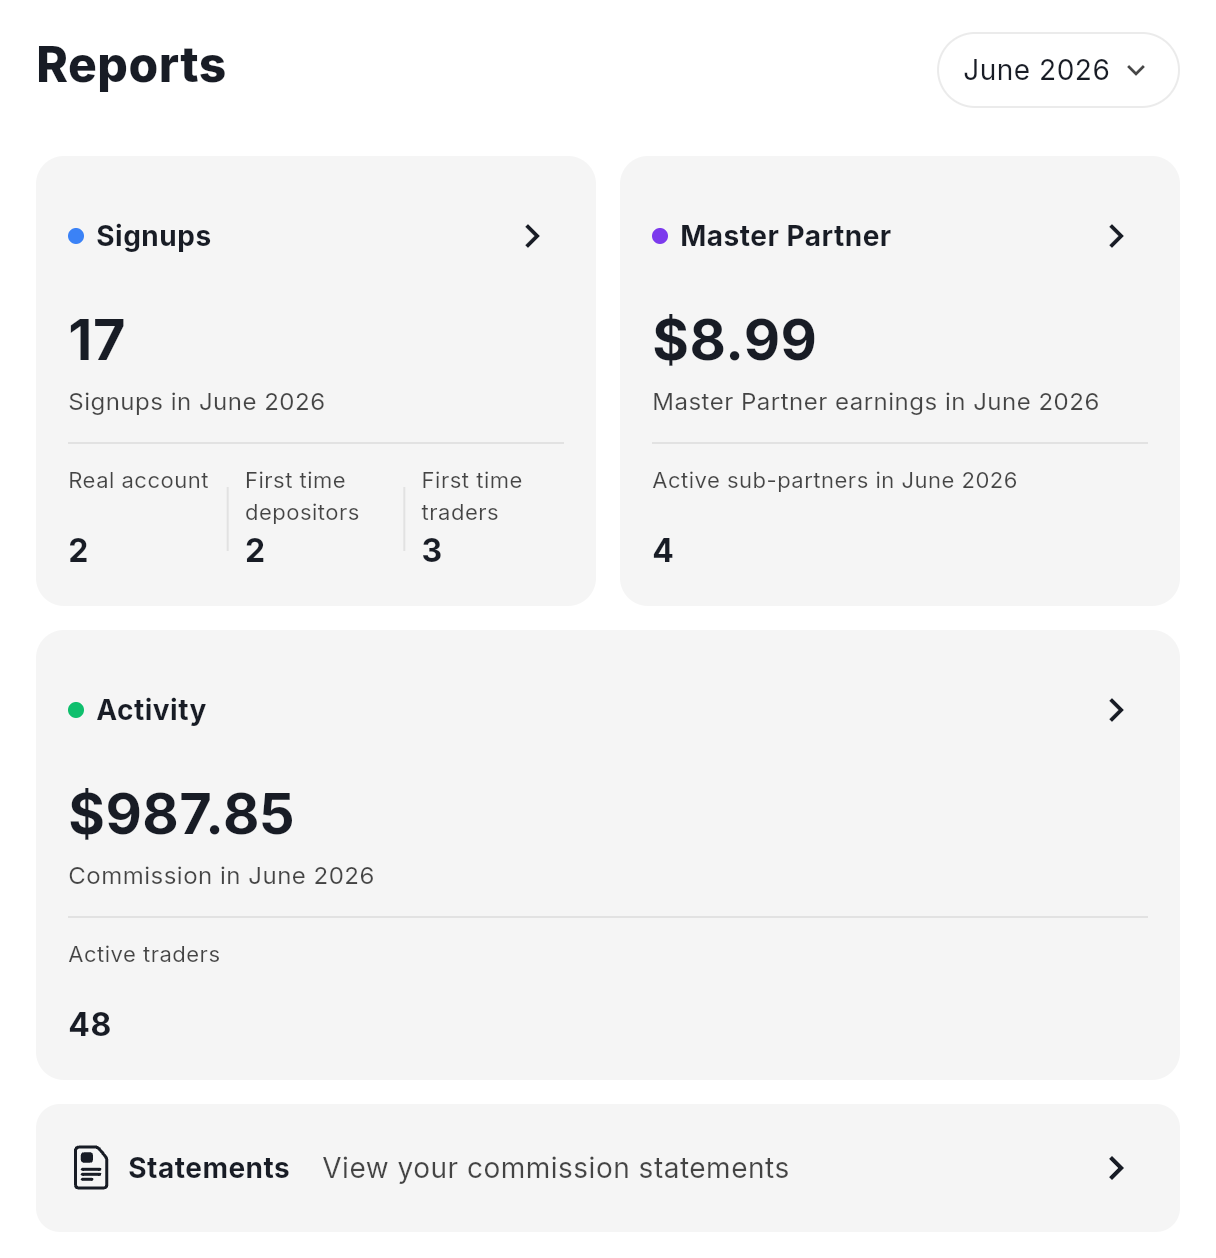
- Log in to your Partners Hub and open the Home page.
- Scroll down past the Signups, Master Partner, and Activity cards.
- Click Statements — View your commission statements → at the bottom of the Reports section.
- The Statements page opens with the Daily view selected by default. Use the tab controls (Daily / Monthly / Quarterly) in the top right to switch views.
What performance data does the Daily view show?
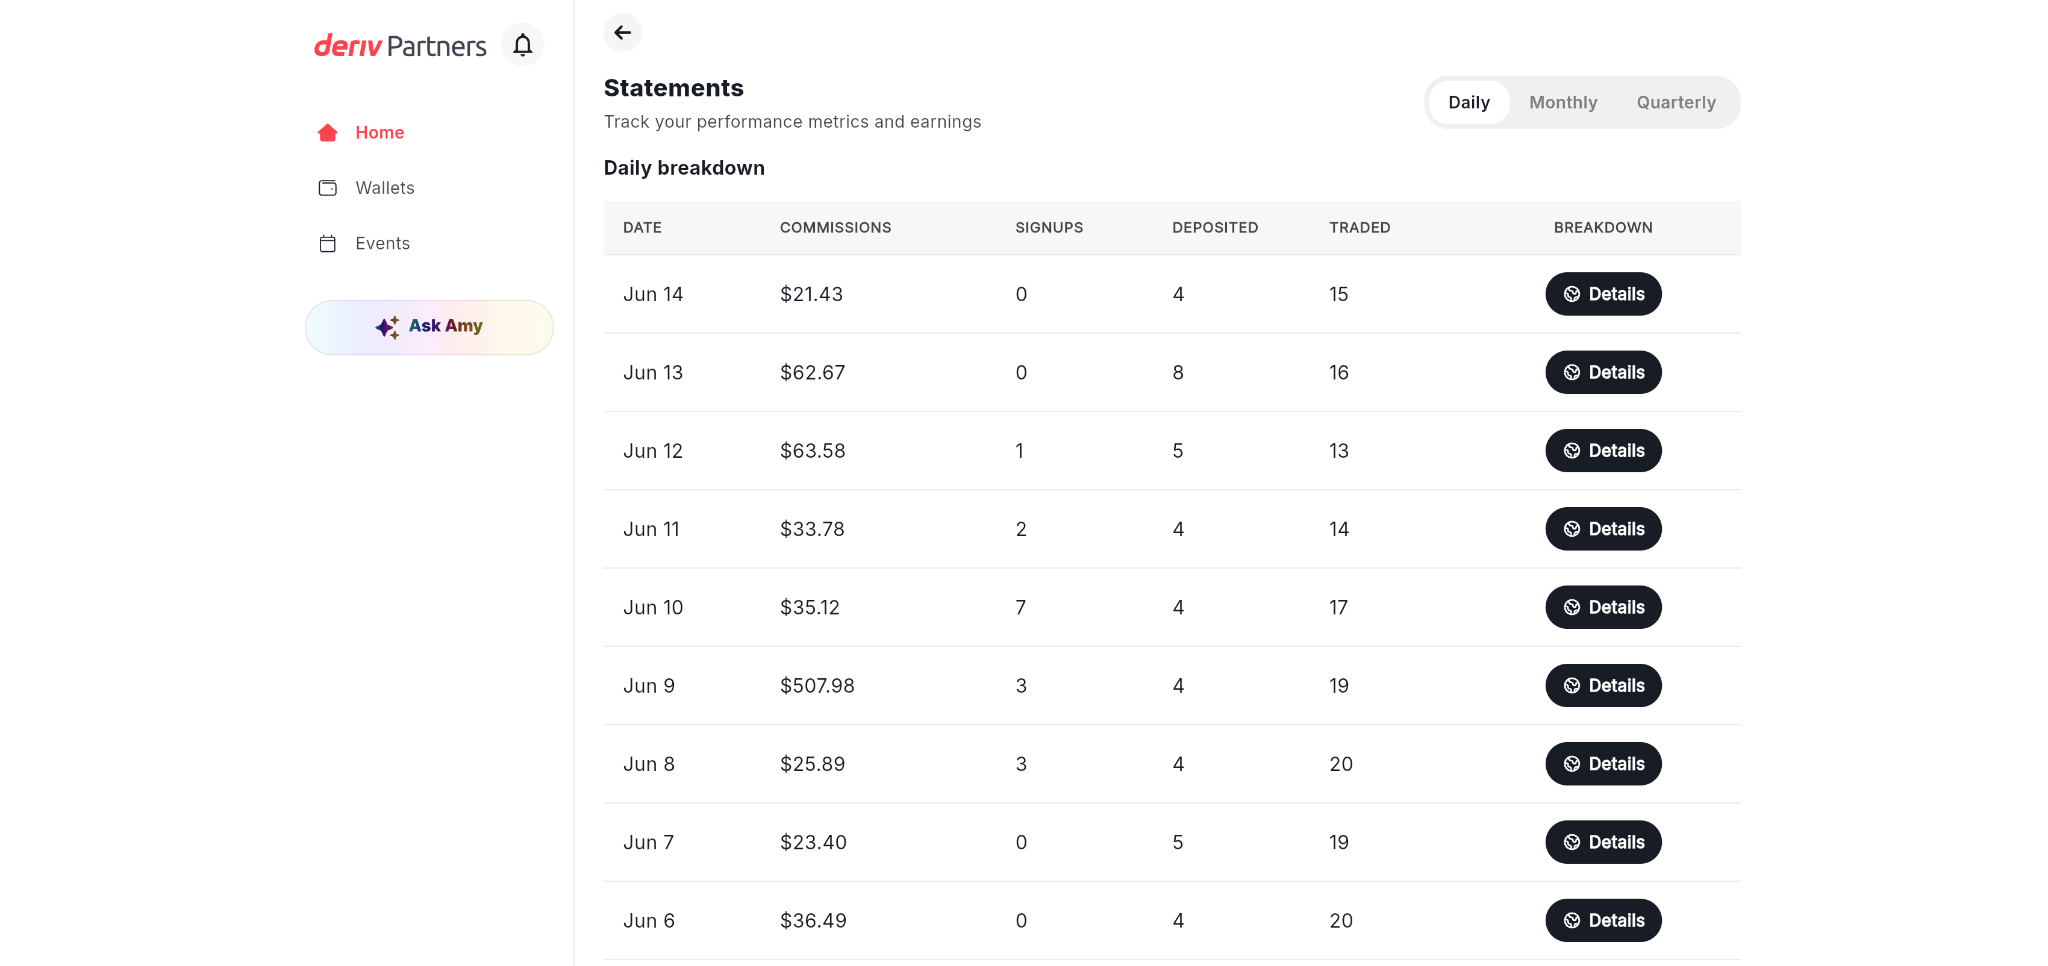
The Daily view shows one row per day, with a Details button to drill further into each date.
Daily breakdown columns
How to use the Daily view for troubleshooting
The Daily view is most useful when you need to investigate a specific date — for example, if you notice an unusually high or low commission figure in the Monthly view and want to understand what drove it.
A quick check can give you useful context:
- High Traded with low Commissions may suggest smaller trading volumes or lower-earning activity.
- A day with many Deposited but few Traded shows that clients are funding their accounts but not yet placing trades. Use the Daily view to see what may have contributed to that day’s commission.
How do I track performance trends using the Monthly view?
The Monthly view shows one row per calendar month and is the most useful view for tracking trends and comparing periods.
Monthly breakdown columns
What is the difference between Commissions and Tiers?
The Tiers column tracks earnings that come from your partner tier level, separate from what your clients generate in trading commission. A value of $0.00 in Tiers means no tier bonus was earned in that month. When Tiers shows a positive figure, it means your tier level contributed additional earnings on top of your trading commissions. Understanding commissions and tiers helps you see how your earnings can grow over time.
Identifying traffic conversion gaps in the Monthly view
To better understand your results, review the stages between signups, deposits, and trades. This helps you spot where clients are dropping off:
- Healthy pipeline growth: Commissions trending upward alongside growing Traded figures means your client base is becoming more active — a healthy pattern.
- The registration gap: Signups staying flat or growing while Deposited stays low suggests clients are registering but not funding their accounts. This indicates a conversion gap between signup and first deposit.
- The activation gap: Deposited growing but Traded staying flat means clients are funding accounts but not trading. This points to a conversion gap between deposit and first trade.
Comparing consecutive months gives you a clear picture of whether your acquisition and activation are actually translating into earnings.
When should I use the Quarterly view to analyze long-term growth?
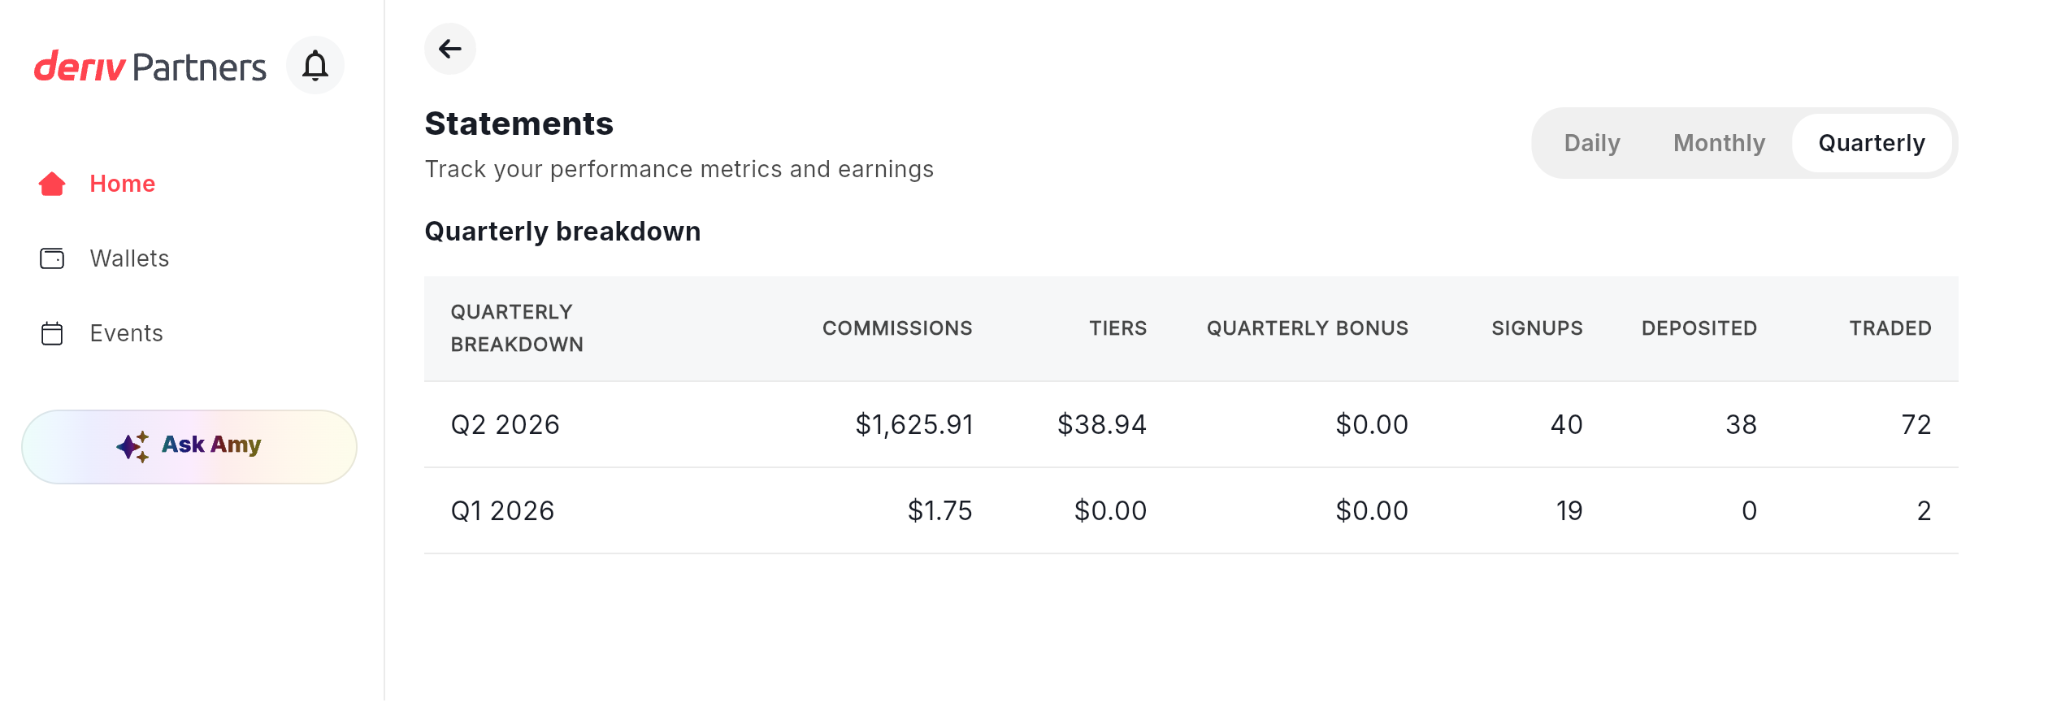
The Quarterly view aggregates your data by quarter. It adds two columns that don't appear in the Daily or Monthly views: Tiers (at the quarterly level) and Quarterly bonus.
Quarterly breakdown columns
How the Quarterly view connects to Monthly
Quarterly figures summarise the quarter. For earnings-related amounts, you can compare the quarterly total with the relevant monthly figures, but client counts may depend on how Partners Hub calculates unique activity across the period.
This means you can use the Quarterly view to see a high-level view of your growth trajectory, then drop into the Monthly view to understand which specific months drove that expansion.
Illustrative figures only — not verified or representative of typical earnings.
How do I audit my business?
Use your Statements data to review where clients drop off in the signup, deposit, and trading journey.
- Acquisition phase
- Signups → Check: Tracking links
- Activation phase
- Deposited → Check: local payments
- Scaling phase
- Traded → Check: Volume churn
By running this review process on a set operational schedule, you can align short-term trader habits with your macro growth incentives:
Step 1: Trend analysis
- Open the Monthly view in your Partners Hub to review performance over the past month. If your trading commissions are decreasing while your active client counts remain stable, your clients may be trading less actively. This may mean clients are trading less actively or placing smaller trades.
- Monthly view: Which months were strongest, and where do clients drop off between signups, deposits, and trades?
Step 2: Isolate anomalies
- If a specific month shows a sharp drop in revenue performance, switch immediately to the Daily view. Identify the dates where the change happened and click Details. This allows you to check whether the contraction was caused by a temporary drop in active trading days or a localised funding bottleneck on that specific date.
- Daily view: What happened on a specific date, and what caused the change in commission?
Step 3: Quarterly scale
- At the close of each trailing quarter, open the Quarterly view to review how your partnership is progressing. Cross-reference your aggregate quarterly trading volume against your Tiers column and your separate Quarterly bonus payouts. Use this data to see whether your current activity is moving you towards the next tier before the period resets.
- Quarterly answers: How is my partnership growing over time, and what role are tier bonuses playing?
Illustrative figures only — not verified or representative of typical earnings.
What is the difference between the live Activity feed and Statements?
The Activity section on your Home page shows your current month's commission and active traders — it is a live view. Statements is your historical record. It is the place to go when you need to look back, compare periods, or verify that what you earned in a previous month matches what you expected.
The Tiers and Quarterly bonus columns also only appear in Statements. If you want to understand the full picture of what you earned — not just trading commissions, but also tier-related bonuses — Statements is the only place where all of that data sits together in one unified layout.
Your commission statements are the most complete record of your partnership's financial performance. They show not just what you earned, but the activity that drove those earnings — how many clients signed up, deposited, and traded — across any time frame you choose to examine. Make reviewing these statements a regular part of your operational routine to maintain clear financial oversight over your digital acquisition channels.
FAQs
What is the difference between Commissions and Tiers in Statements?
Commissions are the earnings generated by your referred clients' trading activity. Tiers are a separate category of bonus earnings linked to your partner tier level. They appear as different columns because they come from different sources — one from your clients' trades, the other from your position in the partner programme's tier structure.
Why does my Daily view show Commissions but my Signups column shows zero for some days?
Signups in the Daily view counts new clients who registered on that specific day. It is possible to earn commission on a day when no new clients signed up — your existing active traders are generating volume regardless of whether new clients arrive. A zero in Signups simply means no new referrals came in on that date.
What is the Quarterly bonus column in the Quarterly view?
The Quarterly bonus is a separate earnings category that appears in the Quarterly breakdown. It is shown independently from Tiers, meaning the two come from different parts of the partner programme. Contact your country manager or check your commission plan details to understand the conditions under which the Quarterly bonus applies.
How do I use the Details button in the Daily view?
Click Details on any row to open a further breakdown of that day's activity. This is useful when you want to understand exactly what drove the commission figure for a specific date — for example, which clients traded or which products generated activity.

Quiz