Deriv Partners Hub dashboard guide: How to optimise performance
Track trading commission on Deriv and monitor your conversion metrics with this comprehensive reporting overview.
Your Partners Hub Home page is the main place to check your key partner performance data. This page helps you view your partner performance data in one place. It bridges marketing channels and financial performance by unifying real-time user acquisition funnels, multi-tier network hierarchies, and commission payout metrics. Understanding your Partners Hub allows partners to track changes in balances, verify link-attribution parameters, and execute data-driven campaigns to maximise cross-border conversion streams.
Quick summary
- Centralised tracking: The interface unifies the top-level wallet balance with monthly performance datasets across distinct client conversion stages.
- Granular signups table: Live tracking maps user identification numbers, geographical location data, and registration statuses to locate active conversion gaps.
- Volume-driven commission insights: The activity logs isolate revenue splits by financial product categories, sorting CFD volumes from Options turnover profiles.
- Multi-tier network management: Enrolled partners can evaluate sub-partner contribution hierarchies to systematically build indirect recurring revenue channels.
What are the key entities inside the tracking dashboard?
- Partners Hub Home Page: The unified B2B user portal serving as the master console for partner administrative, link generation, and analytical data operations.
- Partner Wallet Balance (Earnings): The total volume of your available wallet balance, which you can withdraw or transfer.
- Reports section: A dynamic analytical reporting engine filtered by custom calendar months that tracks real-time client acquisition, multi-tier contributions, and active trade metrics.
- Active Trader: A uniquely attributed user who has generated valid, commissionable trading volume in live financial markets during the currently selected reporting window.
- Master Partner Program: A multi-tier partner structure enabling master partners to recruit sub-partners, allowing for commission percentages based on the transaction volume of their network. Earnings are not guaranteed and depend on actual traded volume generated by referred users.
The Home page at a glance
When you log in, the Home page loads with three distinct areas:
- Earnings banner — a dark banner at the top showing your total wallet balance
- Your referral link — a card with your two referral links and sharing options
- Reports — a dashboard section with your monthly performance cards
On the right side of the page, there is also an Upcoming events panel, which shows any partner events or webinars Deriv has scheduled.
The Earnings banner
The Earnings banner shows the current balance in your partner wallet. This is separate from the commission shown in Reports for the selected month.
The eye icon next to the figure lets you hide or show the balance, useful if you're sharing your screen. Clicking the arrow on the right takes you to your Wallets page, where you can see recent transactions and initiate withdrawals or transfers.
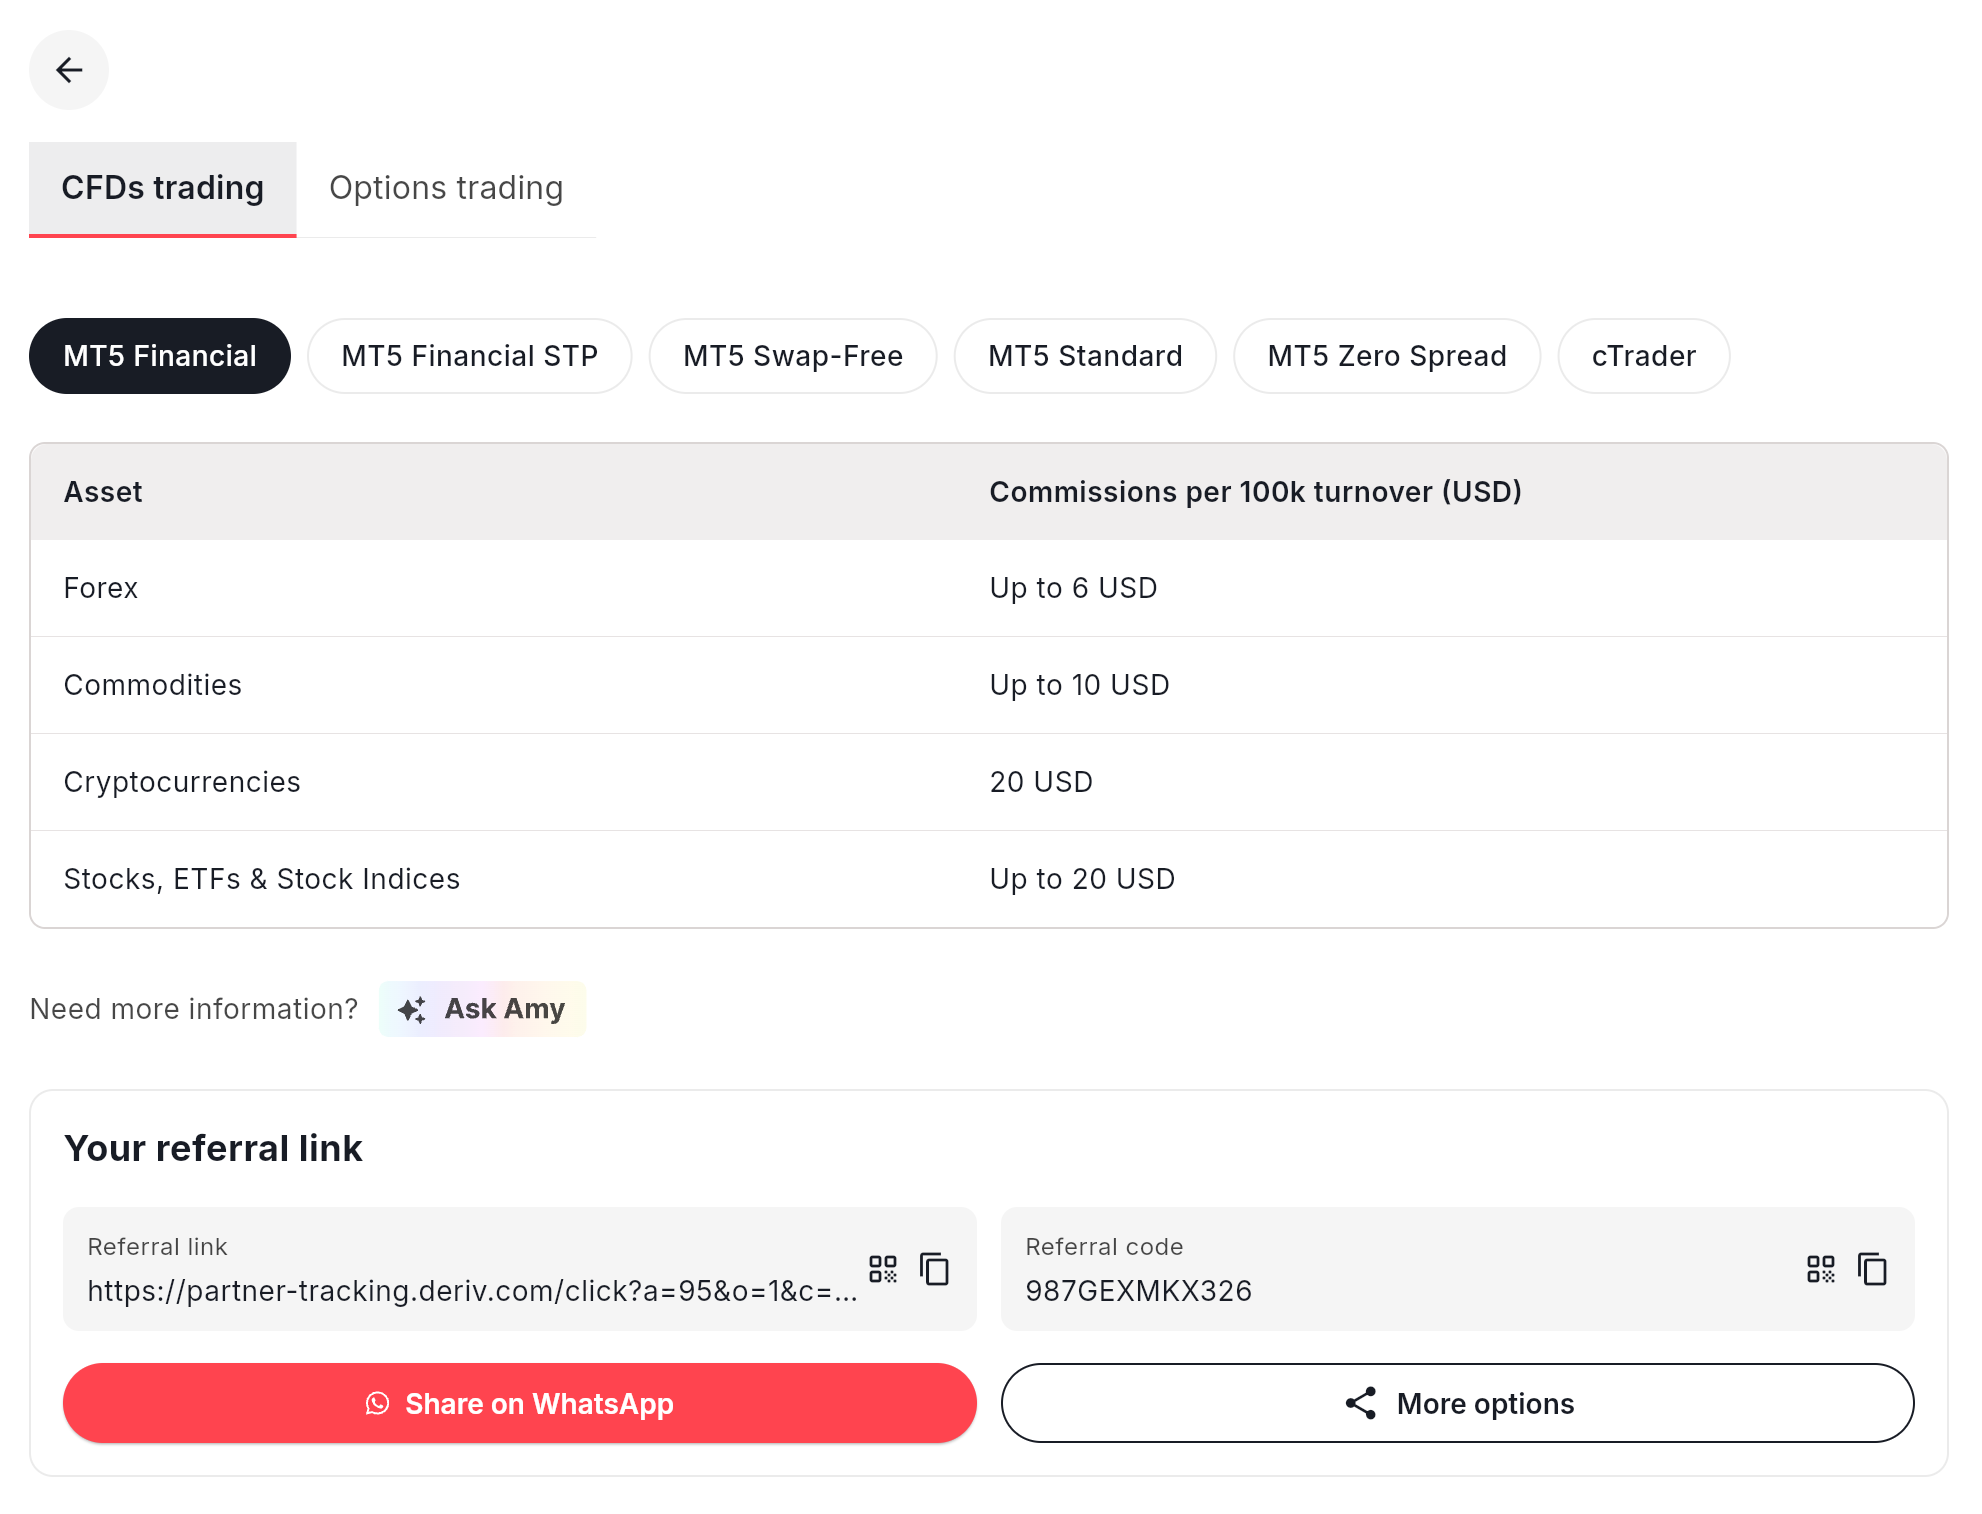
Your referral link
Below the Earnings banner, the referral link section may show tabs such as Revenue Share and Turnover, depending on the commission plans available on your account. Select the tab for the plan you want to promote to see the relevant link and referral code.
Each tab shows:
- Referral link — the full tracking URL to share with your audience
- Referral code — a shorter alphanumeric code (e.g. 987GEXMKX326) that can be used as an alternative to the full link
- Share on WhatsApp — a shortcut to share directly to WhatsApp
- More options — additional sharing formats
You can also click View commission plan details to see the rate structure for your current plan.
The Reports section
The Reports section is the core of your performance dashboard. It sits below the referral link card and contains three clickable cards: Signups, Master Partner, and Activity.
All three cards show data for the month selected in the month dropdown (top right of the Reports section). You can change this to review any previous month.
Each card shows a summary figure. Clicking the arrow on any card opens a detailed breakdown page.
How to track trading commission on Deriv using the monthly Reports section
The Reports section sits below your referral link card. This component isolates data to the individual calendar month selected via the dropdown selector located at the top right of the data panel. Adjusting this month selector re-indexes all visual charts and performance summaries instantly, allowing you to establish precise chronological data baselines.
The Reports section contains three clickable cards: Signups, Master Partner, and Activity. Clicking the structural arrow icons embedded on any of these performance cards navigates away from the overview screen and launches highly detailed diagnostic data sheets.
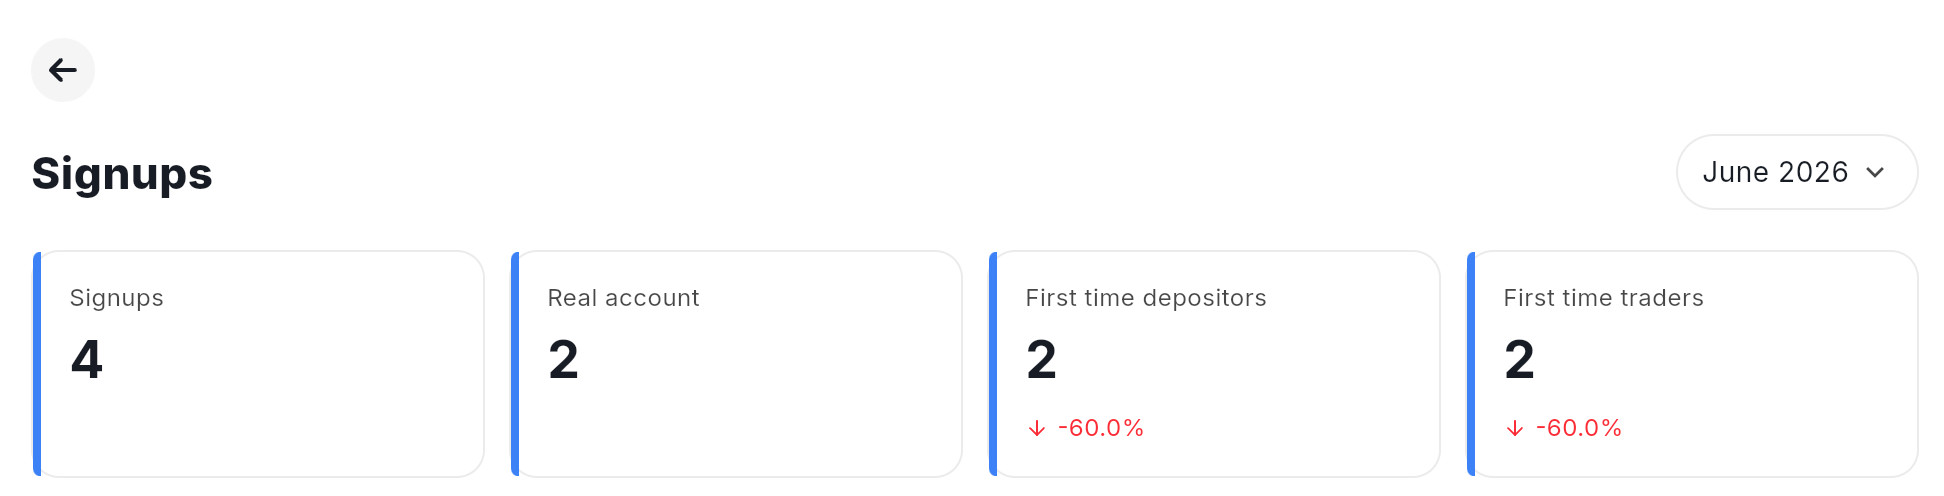
Which conversion metrics matter most in the Signups tab?
The Signups Card provides a four-tier analytical view of your user acquisition funnel. It monitors how effectively your traffic converts from passive interest into active, funded trading profiles.
The four core funnel metrics:
- Signups: The absolute volume of global tracking profiles tagged directly to your unique partner identification code during the current monthly cycle.
- Real Account: The exact number of those registered users who successfully passed identity verification protocols and initiated a live trading profile.
- First Time Depositor (FTD): The number of verified live account holders who completed their initial capital funding transaction during the current month.
- First Time Trader (FTT): The final conversion stage, tracking clients who executed their first market transaction in a live trading environment.
The Signup breakdown table structure
When navigating deeper into the Signup detail page, your operational dashboard presents every individual account registration under a structural auditing log:
What to look for
A client showing Demo status with 0.00 trading volume has been successfully attributed to you but hasn't started live trading yet. This is a conversion opportunity, not a tracking problem.
A client showing Real status with trading volume may contribute to your commission, depending on your commission plan and eligible trading activity. Check the commission column for the amount earned. If the volume is high but your commission seems low relative to it, check your commission plan rate — the relationship between volume and commission varies by plan.
How to track commission on Deriv Partners Hub using the Activity card and trader breakdown
The Activity card on the Home page provides real-time transparency into gross earnings profiles and maps volume attribution across all financial instruments. This module displays two core diagnostic numbers: total monthly commission earned and the active trader headcount.
- Commission — your total commission earned in the selected month
- Active traders — the number of clients who generated trading volume in the selected month
Inside the Activity detail page
Clicking the Activity card opens a detailed page with three sections.
- Total Commission: A single consolidated financial figure tracking your net earnings across all underlying assets for the current billing interval.
- Product Breakdown Logs: Segmented reporting lines dividing your metrics into distinct product streams. If your audience trades multi-asset CFDs via Deriv MT5, your volume and commission will display separately from users trading Options on a Revenue Share or Turnover commission plan.
- Commission Breakdown Chart: A visual chart that maps asset allocation percentages. If your entire partner network trades solely through CFD infrastructure, the graphic renders as a uniform, single-colour segment.
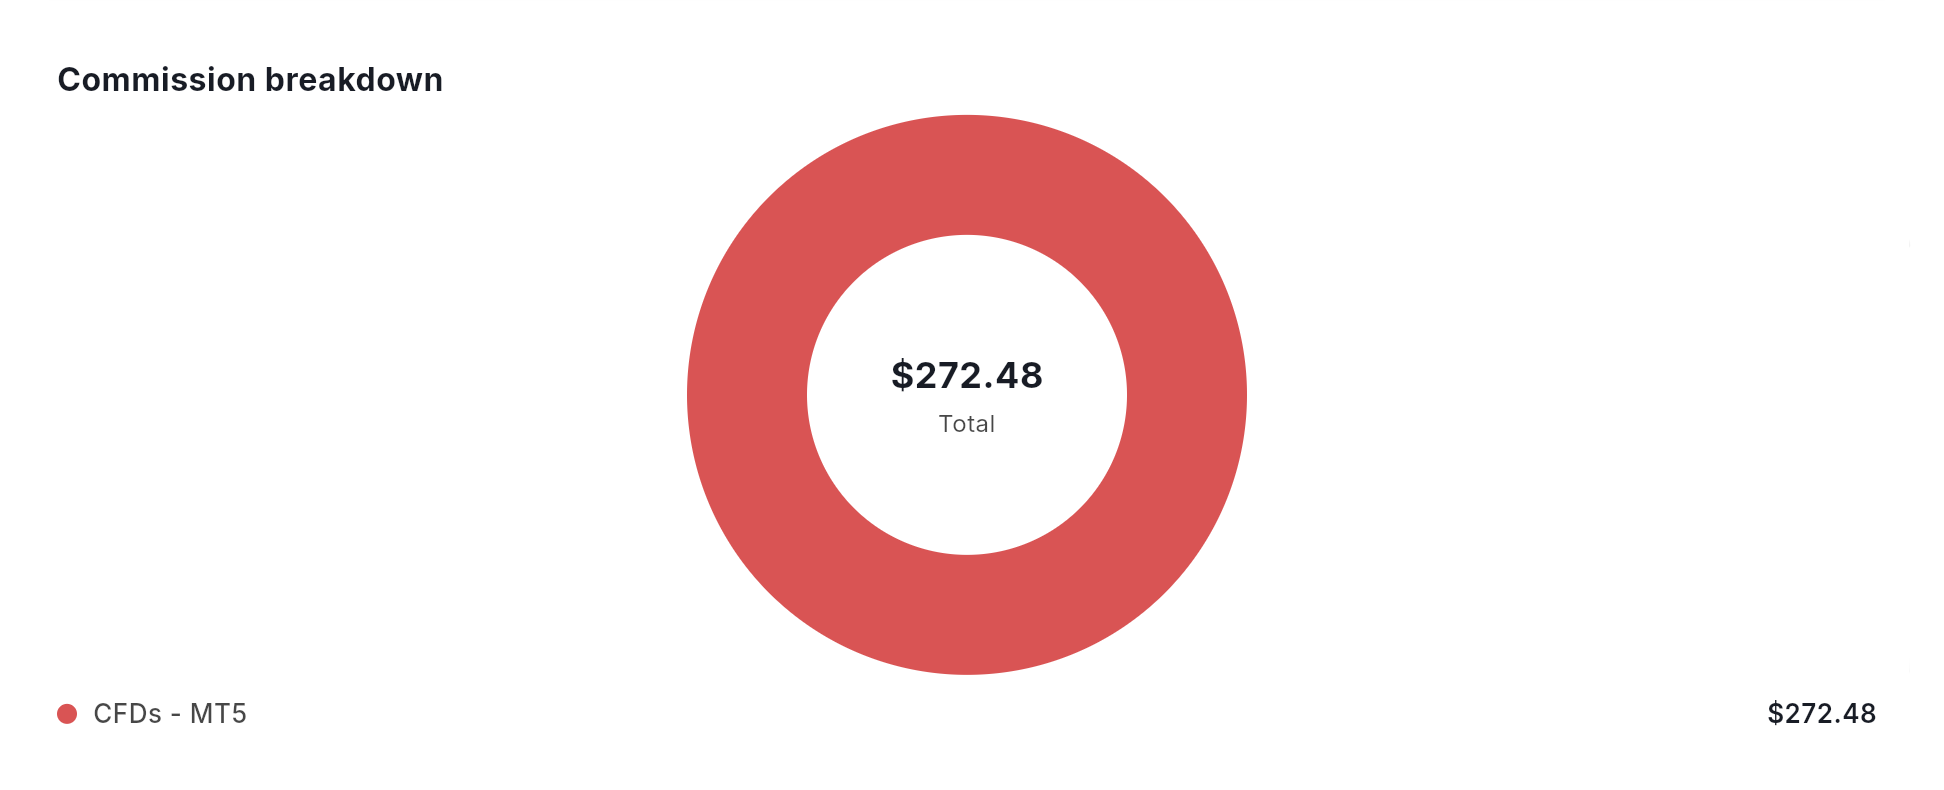
The chart data displayed is for illustrative purposes only. Illustrative figures only — not verified or representative of typical earnings.
If you are viewing the current month, commission figures may still change until the month is finalised and commissions are processed.
The Active Trader breakdown table
Below the chart is the Active Trader Breakdown — a table showing every client who generated trading activity in the selected month. This table has three tabs:
- CFDs — clients trading on CFD platforms (e.g. Deriv MT5)
- Options - Revenue Share — clients trading Options on a Revenue Share commission plan
- Options - Turnover — clients trading Options on a Turnover commission plan
Review the tabs that apply to your referred clients’ activity and commission plans.
How does the Deriv Master Partner programme work for multi-tier sub-partner earnings?
The Master Partner Card provides performance statistics for your nested network of sub-partner. This data space tracks your passive revenue layers and only populates with information if you are explicitly enrolled in the Master Partner track.
Master Partner Performance Columns:
- Client ID: The unique identification sequence tracking the sub-partner you successfully recruited into the ecosystem.
- Level: The relative structural depth of the sub-partner inside your network tier (e.g., Level 2 [L2] specifies a direct sub-partner referral).
- Contributions to You: The precise financial payout value generated for your wallet by the transaction volume of that sub-partner's active user base.
You can toggle this interface view between This Month and All Time performance metrics. This comparison allows you to spot high-performing sub-partners, helping you identify who to support with co-branded marketing assets or tailored training resources to scale your indirect revenue.
How to use the Reports section together for a comprehensive monthly review
Each card in Reports tells you something different. Reading them together gives you a full view of your business performance. Use this structured routine to systematically optimise your portfolio:
Step 1: Check Signups ──> Identify Demo-to-Real conversion gaps
Step 2: Check Activity ──> Compare active traders against total user base
Step 3: Analyse Breakdown ──> Check for volume concentration across top accounts
Step 4: Audit Master Partner ──> Review growth and contribution tiers of your sub-IBs
- Check signups: Note total signups versus real accounts. If the gap is large, focus your marketing content on helping demo clients make the move to live trading.
- Check activity: Compare active traders to your total attributed clients. A low ratio means most of your base isn't trading this month, signalling a need for engagement campaigns.
- Check the active trader breakdown: Identify your highest-volume clients. If a small number of traders account for most of your commission, your income depends heavily on those few accounts staying active.
- Check Master Partner: See whether your sub-partner network is growing and contributing to your bottom line over time.
The Partners Hub Home page gives you everything you need to understand how your partnership is performing — from new signups all the way through to commission earned. The key is knowing which section to go to for which question. Use the month selector to compare periods, and make the detailed breakdowns (Signups, Activity, Master Partner) part of your regular review routine. The numbers are only useful if you check them often enough to act on what they're telling you. No performance, earnings, or activity is guaranteed. The numbers are only useful if reviewed and acted on regularly.
This guide is for informational purposes and does not guarantee any level of earnings or results.
FAQs
What is the operational difference between Earnings and Commission on the home page?
The top Earnings banner displays your actual, liquid wallet balance—funds ready for immediate withdrawal or platform transfer. In contrast, the Commission metric within your Activity card reflects the non-finalised earnings accrued exclusively during your selected month.
Why do I see a high signup volume paired with zero active traders?
The Signups card counts every registration linked to your tracking profile, including users practising on demo accounts. The Active Traders metric counts only real-account users who executed live trades during the selected month. A gap between these values is normal and highlights a clear conversion marketing opportunity.
How do I use the MoM percentage indicator to audit my marketing campaigns?
The Month-over-Month (MoM) percentage tile calculates your current monthly growth against the previous period. A red downward arrow (e.g., ↓ -60.0%) indicates a drop in acquisition speed. Use this signal to adjust your traffic strategies, refresh ad creatives, or optimise your landing pages.
What does "Active sub-partners" mean on the Master Partner card?
This represents the number of sub-partners you recruited who generated live trading activity via their downline networks during the selected month. A sub-partner counts as active only when their referred clients are actively trading—not simply because the sub-partner registered.
Can I see historical data beyond the current month?
Yes. Use the calendar month dropdown selector in the Reports panel to switch between any historical period. All underlying data sheets, tables, and product visualisation charts update instantly to reflect the selected timeline.

Quiz