How to read Deriv partner analytics to boost potential commissions
A guide to diagnosing trader drop-off points. Turn more leads into active clients using your Deriv partner dashboard data.
Your Deriv Partner Dashboard tracks every stage of your referral journey—from first click to commission payout. But raw numbers only tell half the story. The real value lies in spotting where potential clients lose momentum and exit your funnel before generating commissions.
Quick summary
- Identify leaks: Drop-offs can occur at predictable stages: Clicks → Registrations → Deposits → Trading → Commissions.
- Key tools: Use the My Plans section for a total funnel view and Commission Plans to see the Lead-to-client ratio.
- Diagnose & fix: Use specific dashboard patterns to determine if you need to fix your tracking links, KYC guidance, or trading education.
- Optimise: Regular weekly audits can help recover lost commissions by targeting the specific stage where users stall.
What are drop-off points in the Deriv Partner Dashboard analytics?
A drop-off point is a specific stage in the affiliate marketing funnel where a referred user stops interacting before reaching the final conversion goal. In the Deriv Partner Dashboard, these are measured as the "gap" between metrics—such as users who register but do not deposit. Identifying these patterns is the first step in optimising your partner funnel for trading activity.
Check out our course on Dynamic Works Essentials for a complete overview of your Deriv Partner Dashboard.
Which reporting tools identify trader drop-offs?
To effectively monitor your performance, you can utilise these five core areas of the Deriv Partner Dashboard. Each serves as a specific diagnostic lens for your funnel:
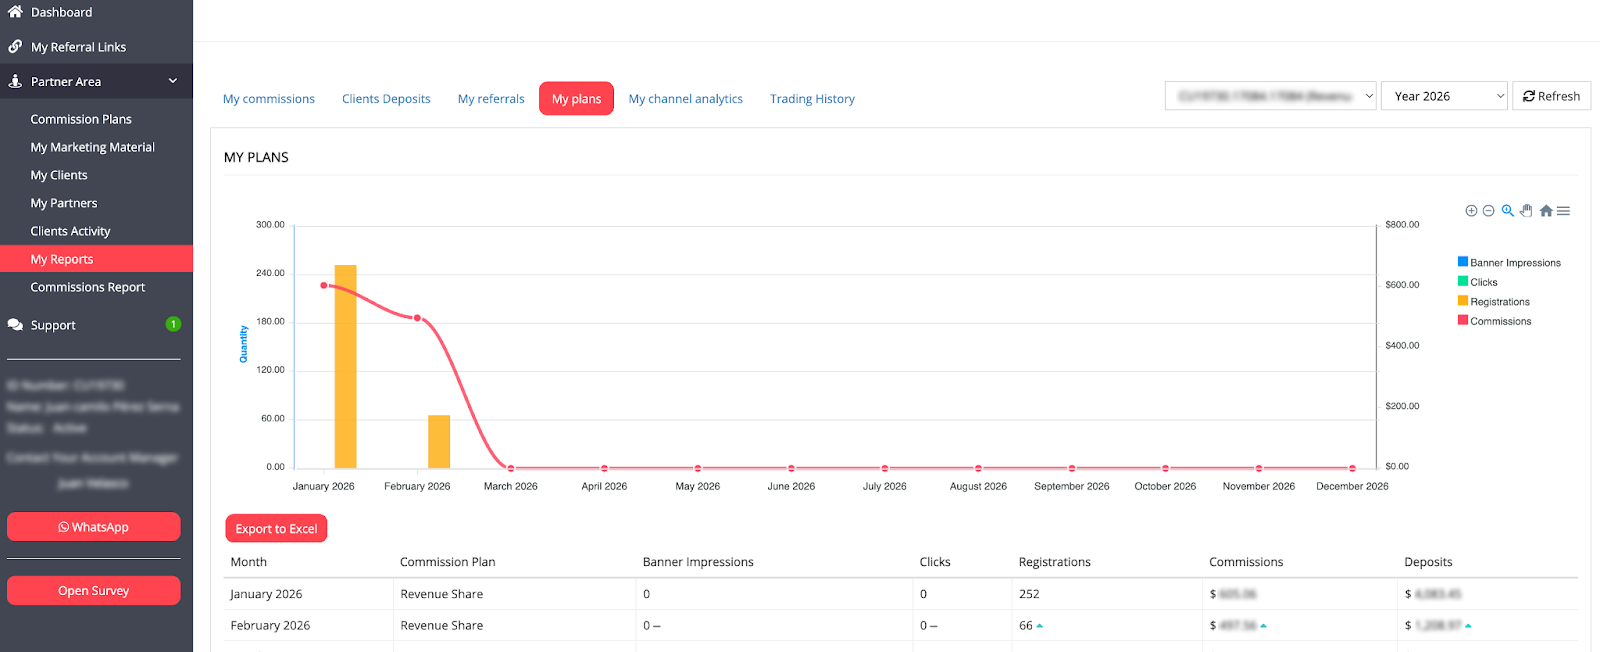
1. My Plans — Your complete funnel view
The My Plans section tracks the entire journey from impressions to commissions. This can be your primary diagnostic tool for identifying which stage loses the most potential clients.
- Key Metrics to compare: Impressions → Clicks (engagement); Clicks → Registrations (intent); Registrations → Deposits (activation).
- How to access: Partner Area → My Reports → My Plans → Select date range.
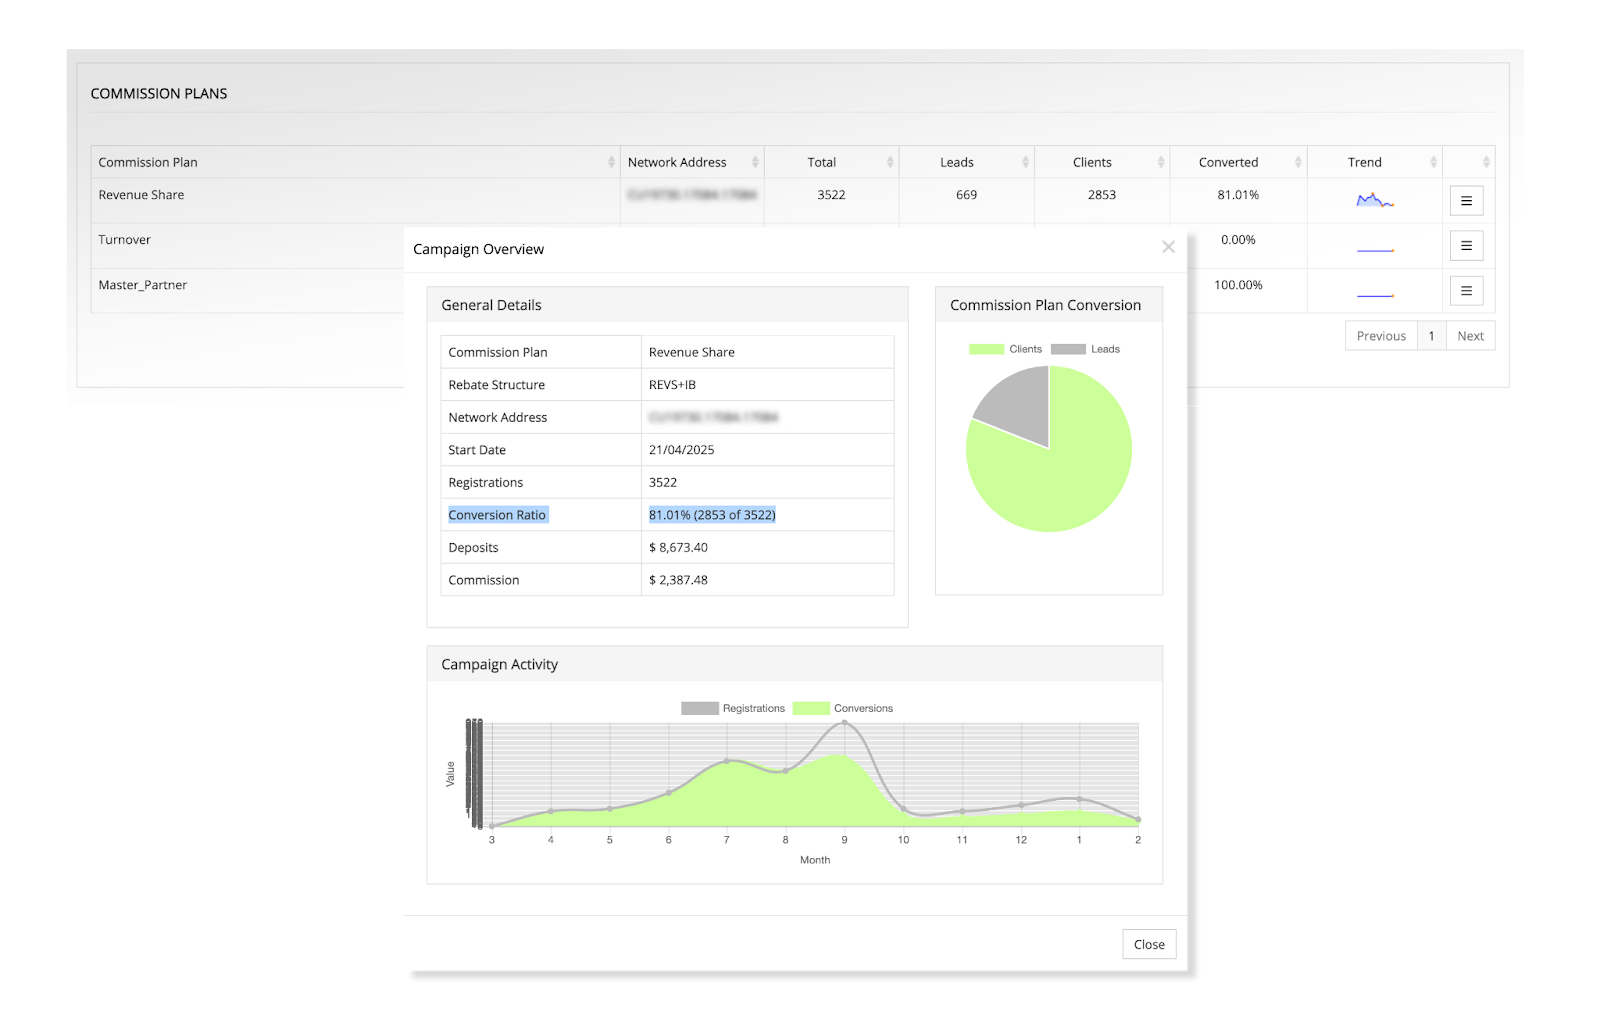
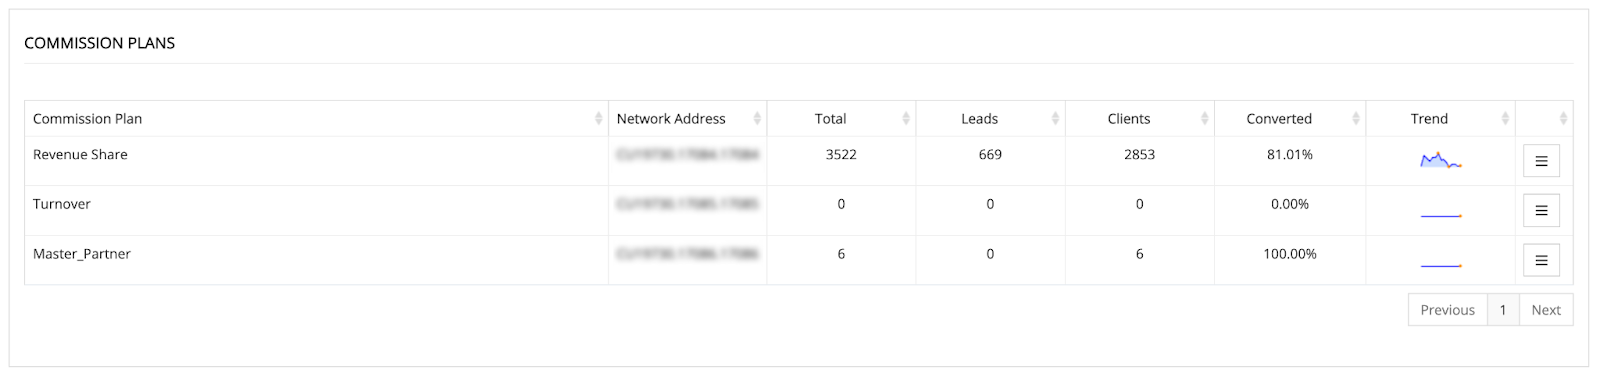
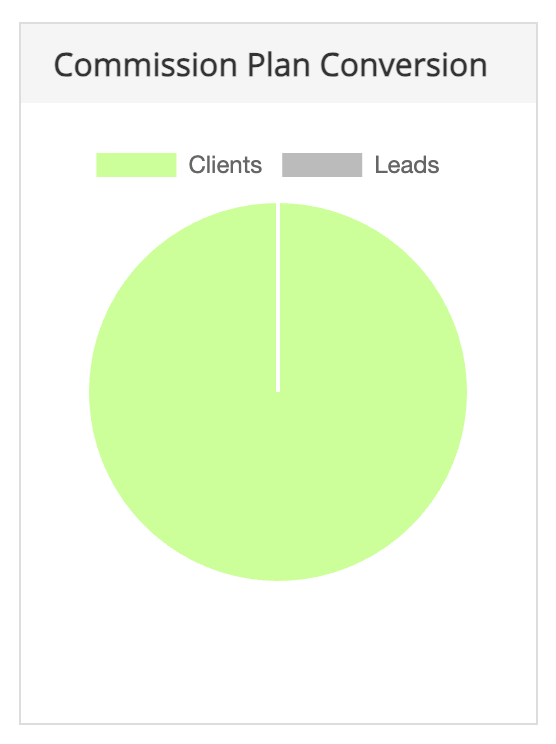
2. Commission Plans — Leads vs. clients breakdown
This section displays a critical distinction: Leads (registered, non-trading) versus Clients (active traders).
- The signal: A high Lead count with low Client conversion may indicate a drop-off immediately after registration. The pie chart visualisation makes this instant—large grey sections signal a leaking funnel.
- How to access: Partner Area → Commission Plans → Review "Conversion Ratio %".
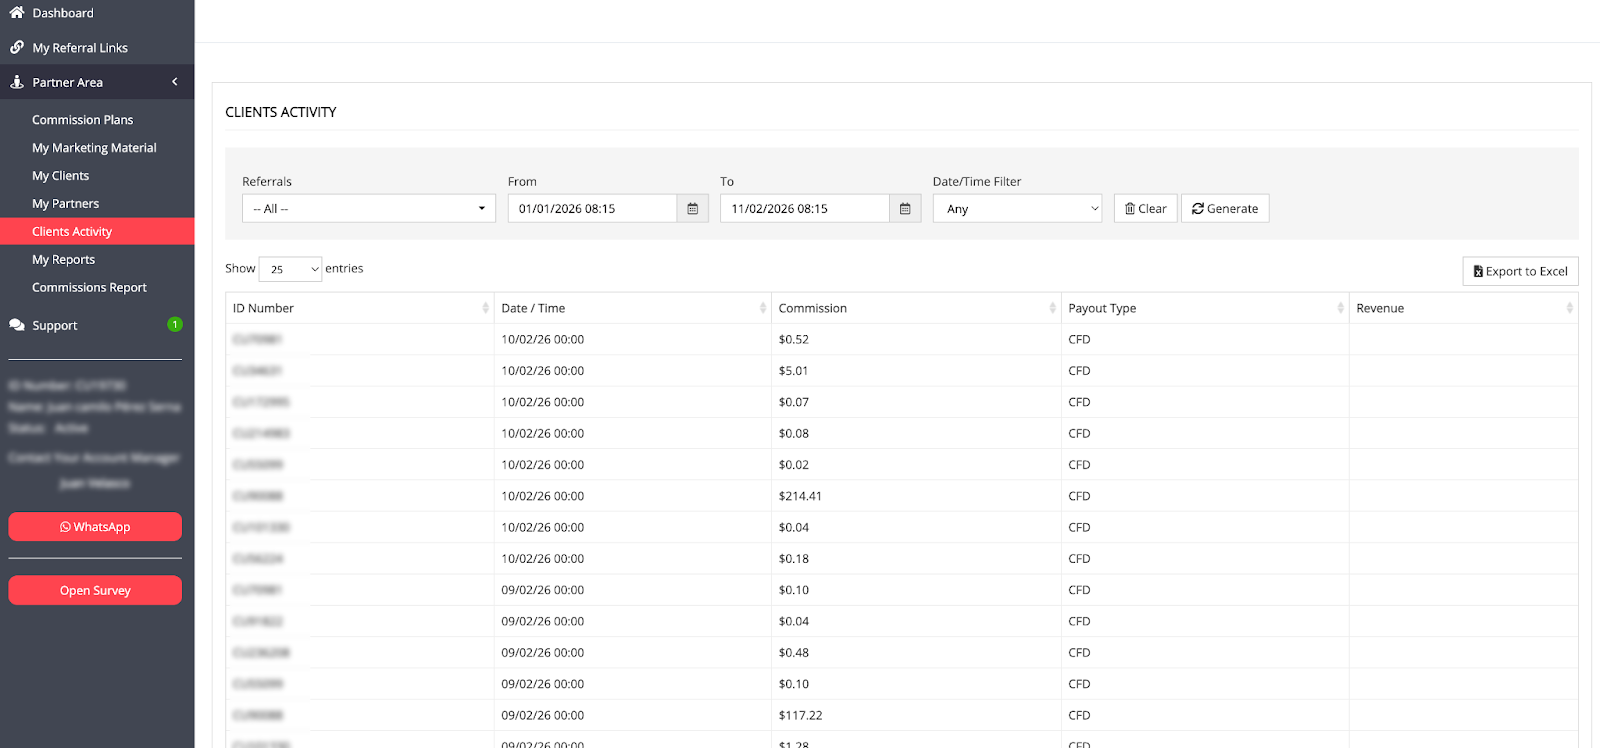
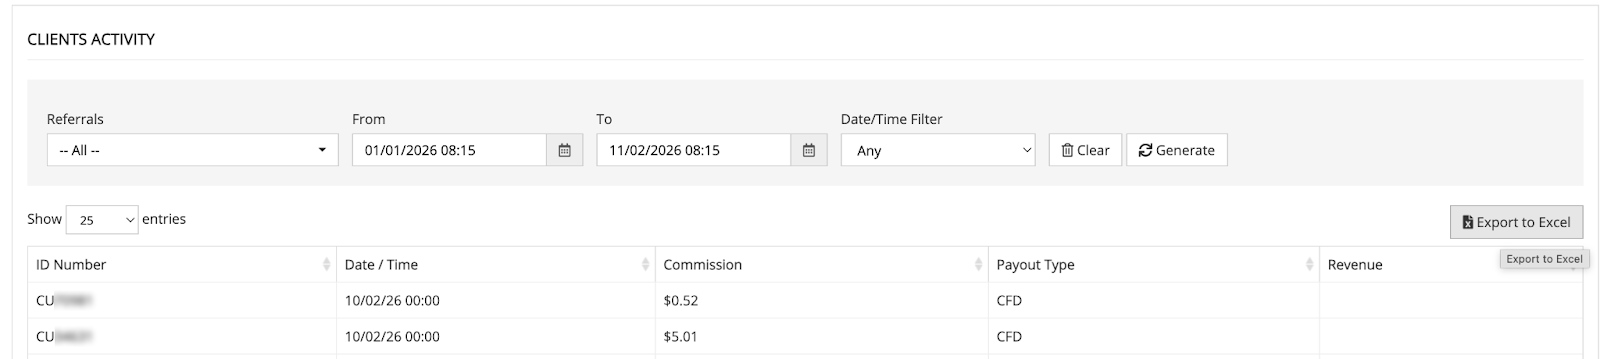
3. Clients Activity — Individual behaviour patterns
This screen provides granular data on referred users, helping you distinguish between high-value traders and one-time visitors.
- The signal: Many unique Client IDs with only single commission entries may suggest users tried the platform once and left. Repeated IDs likely indicate successful retention.
- How to access: Partner Area → Clients Activity → Export to Excel for pattern analysis.
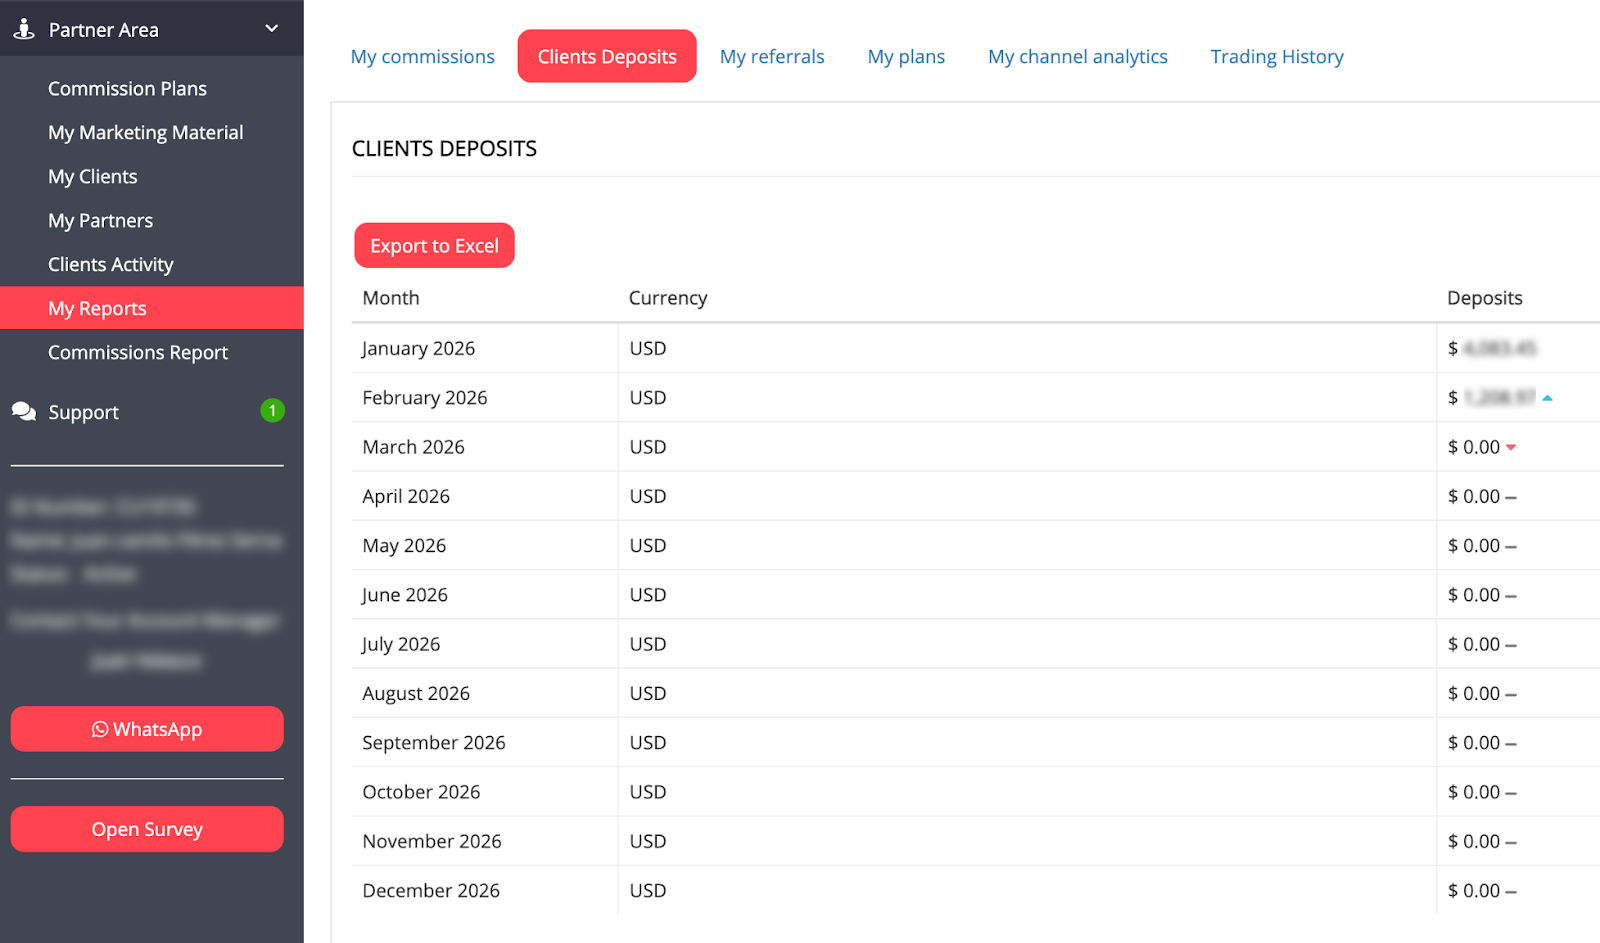
4. Clients’ deposits — Funding pattern analysis
Tracking monthly funding behaviour helps you spot if your audience is "stuck" at the wallet stage.
- The signal: If registrations are trending up but deposits remain flat, you have a specific barrier between signup and funding (often KYC or payment method confusion).
- How to access: Partner Area → My Reports → Clients Deposits → Review monthly directional arrows.
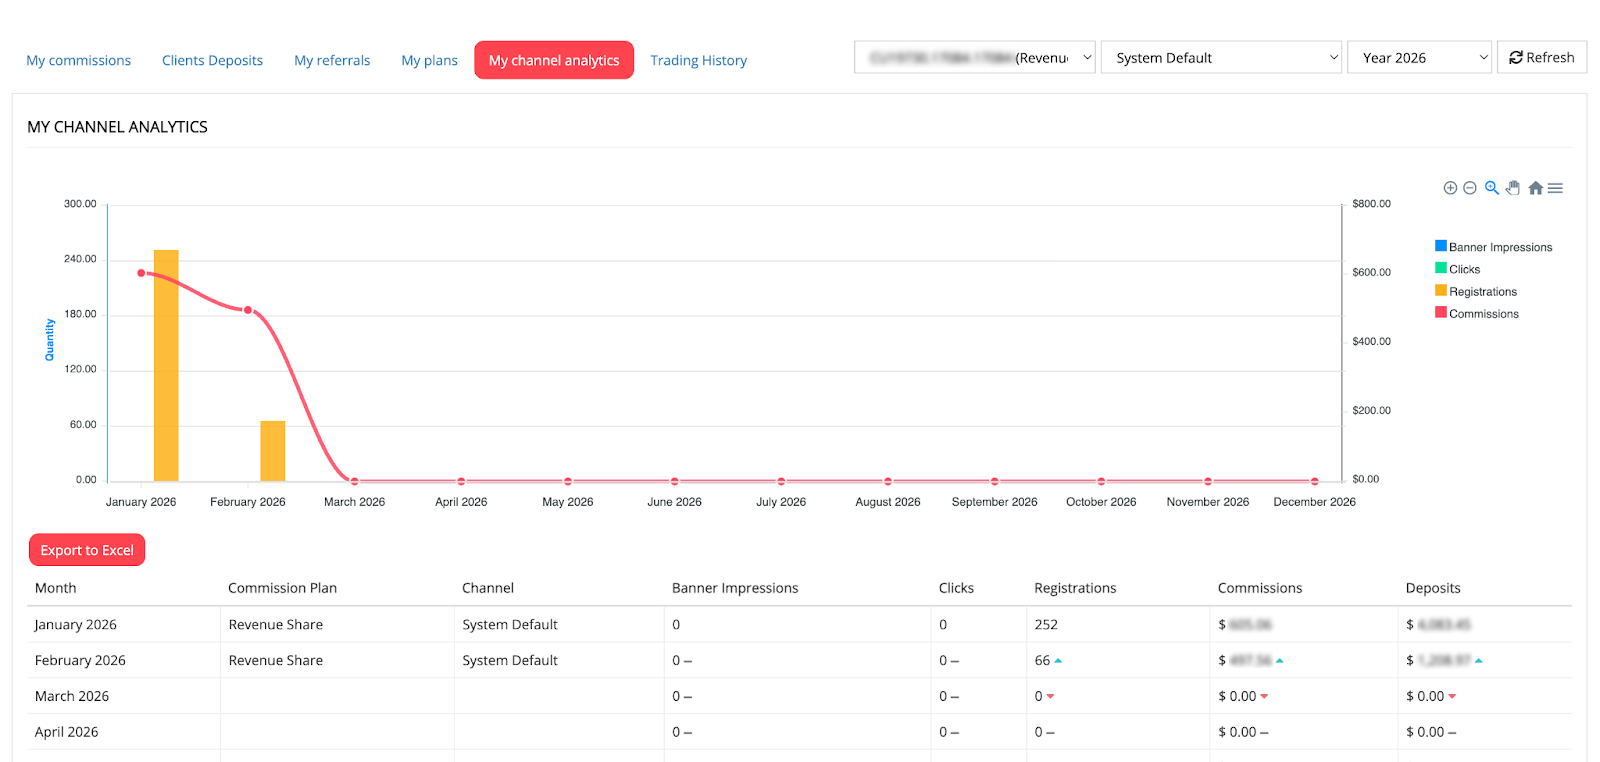
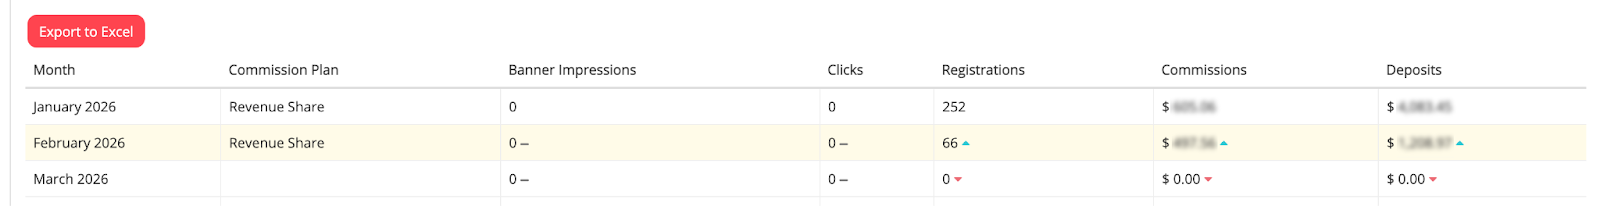
5. My Channel Analytics — Source-specific leak rates
This section reveals which traffic sources produce quality and which merely produce "noise."
- The signal: You may find a YouTube channel drives high clicks but 0% deposits, while a Telegram group drives fewer clicks but a 20% deposit rate. This allows you to reallocate your budget to high-converting sources.
- How to access: Partner Area → My Reports → My Channel Analytics (requires custom-tagged tracking links).
How to identify drop-offs at each funnel stage
Drop-off point 1: Clicks to registrations
- Where to look: My Plans section — compare Clicks vs. Registrations columns.
- Benchmark: A healthy click-to-registration rate in financial niches is typically 2–5%. Below this suggests high friction.
- What low conversion indicates: Your landing page doesn't match your promotional message; tracking links are broken; or your content attracts curiosity rather than intent.
- Diagnostic steps: 1. Calculate: (Registrations ÷ Clicks) × 100. 2. If below 2%, manually test your tracking links. 3. Audit if your content promise (e.g., "Free Signal Bot") matches the Deriv landing page users see.
Drop-off point 2: Registrations to deposits
- Where to look: Commission Plans (Leads vs. Clients) and Clients Deposits (Monthly trends).
- Benchmark: Conversion from registration to first deposit typically ranges from 5 –15%.
- What low conversion indicates: Users may struggle with the KYC verification barrier, or available payment methods don't match your audience's local preferences.
- Diagnostic steps:
- Check your "Conversion Rate" percentage in Commission Plans.
- If the grey "Leads" section in your pie chart is dominant, the drop-off is here.
- Cross-reference with Clients Deposits to see if funding trends are flat while signups rise.
Drop-off point 3: Deposits to trading activity
- Where to look: Client's Activity screen.
- What low conversion indicates: Clients have funded accounts but feel uncertain about how to place a trade or navigate the platform (Deriv MT5/Deriv cTrader).
- Diagnostic steps:
- Export Clients Activity to Excel and sort by Client ID.
- Many single-entry IDs = clients deposited but did not continue trading.
- Compare total deposit values against your total commission earnings.
How to perform a Deriv partner funnel diagnostic?
Step 1: Identify click-to-registration friction
- Where to look: My Plans (Clicks vs. Registrations).
- The benchmark: A healthy B2B rate is typically 2–5%. If you are below this, your landing page may not match your ad copy, or your tracking links may be broken.
Step 2: Bridge the registration-to-deposit gap
- Where to look: Commission Plans (Leads vs. Clients).
- The fix: If you have many "Leads" but few "Clients," users might be struggling with the KYC (Know Your Customer) process. Create a simple "How to Verify Your Account" guide to nudge them forward.
Step 3: Transition deposits to trading activity
- Where to look: Clients Activity (Check for repeat Client IDs).
- The problem: Users fund their accounts but are too intimidated to place a trade.
- The solution: Share platform walkthroughs for Deriv MT5 or Deriv cTrader to build their confidence.
Drop-off diagnostic table: patterns, causes, and actions
Common drop-off scenarios and fixes
Scenario 1: "I get lots of clicks but barely any registrations"
Diagnosis: Drop-off between the Interest and Consideration stages.
- Check these dashboard areas:
- My Plans: Clicks vs. Registrations comparison.
- My Channel Analytics: Identify which specific source has the lowest conversion.
- The Fix: Audit your "Link-to-Content" alignment. If you are promoting "Professional Digital Options Strategies" but your link sends users to a generic "Forex Sign-up" page, they will bounce. Pre-qualify your audience by being explicit about the platform type in your content.
Scenario 2: "People register but never deposit"
Diagnosis: Drop-off between Consideration and Commitment.
- Check these dashboard areas:
- Commission Plans: Leads vs. Clients breakdown.
- Clients' Deposits: Look for flat funding trends despite rising sign-ups.
- The Fix: This is usually a "Trust or Friction" issue. Create a 60-second video walkthrough of the KYC process or a "Payment Method Guide" specific to your region (e.g., highlighting local e-wallets or crypto options). This removes the "how do I actually start?" anxiety.
Scenario 3: "Clients deposit but I'm not earning commissions"
Diagnosis: Drop-off between Commitment and Action.
- Check these dashboard areas:
- Clients Activity: Look for users who deposited but have zero trading volume.
- Commissions Report: Ensure they aren't trading products excluded from your plan.
- The Fix: The "Demo Trap." Many users deposit but stay on their demo accounts because they fear losing real capital. Bridge this gap by providing risk-management education and a "First Trade Walkthrough" to help them transition to live trading confidently.
3-minute weekly health check
To maintain a high-performance funnel, perform this audit every Monday:
- Calculate your activation rate: (Deposits ÷ Registrations) × 100. Target 5-15%.
- Check lead-to-client ratio: If your grey "Lead" section in the pie chart is over 20%, send a follow-up educational email/message to your community.
- Verify links: Manually click your top 3 performing links to ensure they land on the intended registration page.
FAQs
How do I know if my drop-off rate is too high?
Compare your conversion rates against these general benchmarks: Click-to-registration rates of 2–5% are typical for financial services. Registration-to-deposit conversion of 5–15% is common. Leads-to-Clients conversion rates above 80% often indicate strong audience targeting.
Can tracking issues cause false drop-off signals?
Yes. If your tracking links are broken, incorrectly tagged, or stripped of parameters, the dashboard may show zero conversions even when users complete registration. Always test links manually before diagnosing a drop-off problem.
Which drop-off point should I fix first?
It might be helpful to start with the stage that loses the highest absolute number of potential clients. For example, a 50% drop-off from 1,000 clicks likely costs more than a 50% drop-off from 100 registrations.
How often should I run a full drop-off diagnostic?
Weekly quick reviews catch emerging issues. Monthly deep analyses with Excel exports reveal patterns. Quarterly reviews help identify seasonal trends and strategic adjustments.
What if drop-offs are happening across all stages?
Check for external factors: expired campaigns, broken tracking links, or changes in your promotional content. If everything appears functional, your overall traffic quality may need improvement—focus on attracting more intent-driven audiences.
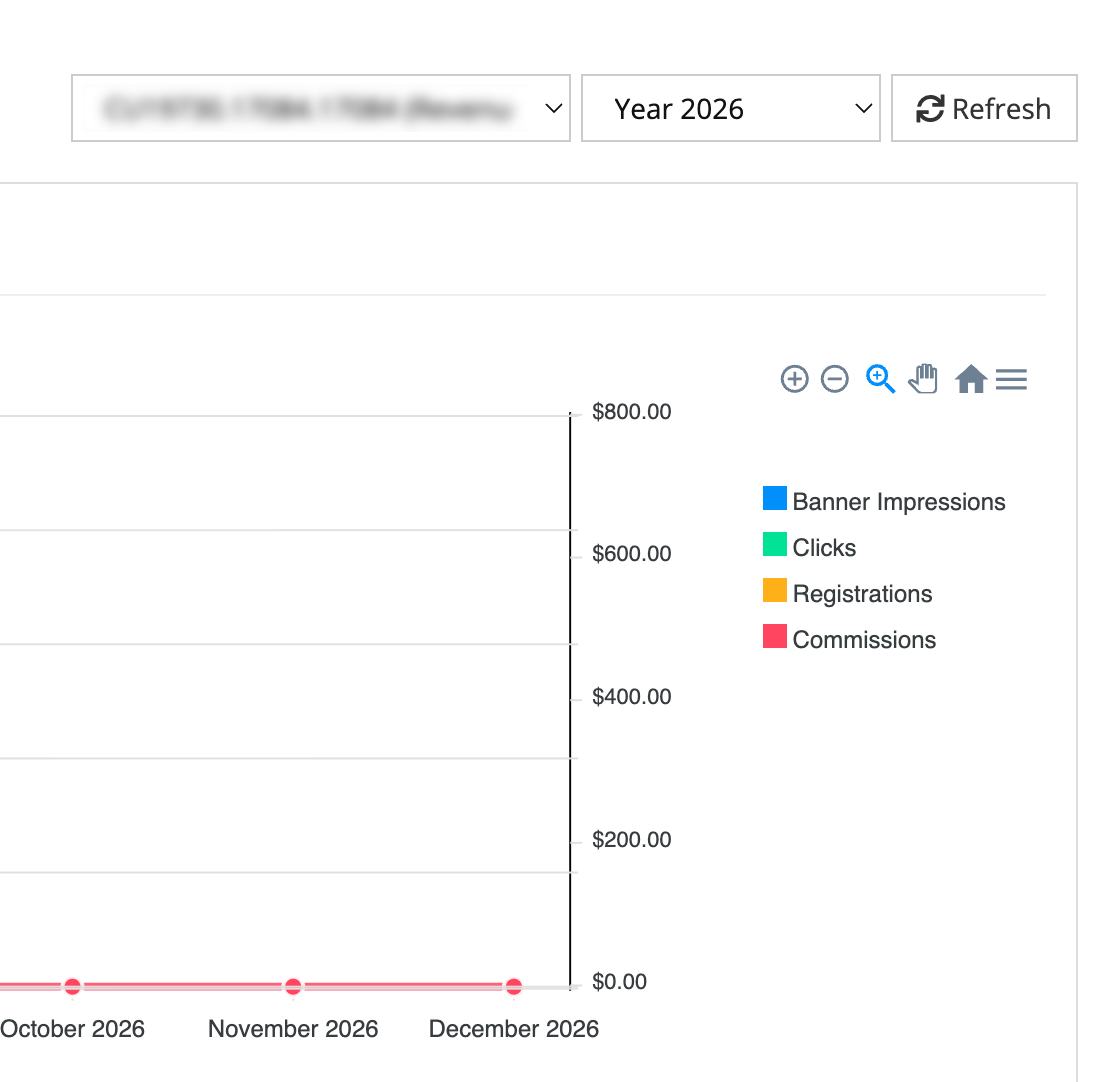
The charts displayed in this article are for illustrative purposes only.

Quiz